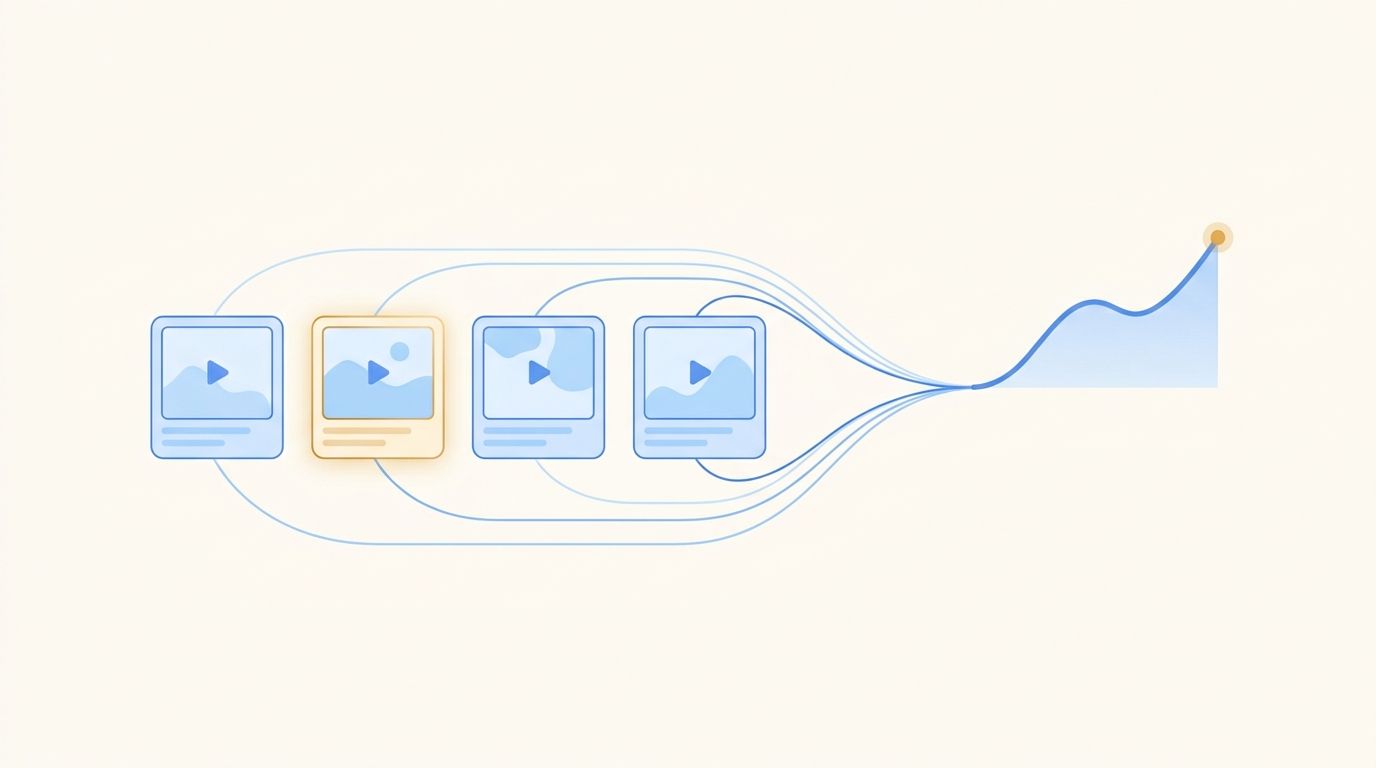
Creative testing usually stops where most ad platforms stop: CTR, CVR, and spend. A user-acquisition team can run dozens to hundreds of creatives across four or five channels, while retention, payer rate, and LTV sit in separate game or app systems.
That split shapes the budget. The creative with the highest CTR gets more spend, even when its users leave early or never pay. Creative fatigue then builds as a slope. CTR can slip a fraction of a percentage point a week, small enough that no single review shows a clear break. By the time blended ROI confirms the decline, the budget has already reached users who did not stay or monetize.
A more reliable method follows every creative from impression through revenue, so the number that decides budget is downstream quality, and the numbers below are illustrative of a common library pattern.
Why does a CTR-first view point you the wrong way?
CTR measures response to an ad. It does not measure the quality of the user after install.
The mechanism is simple. An edgy concept earns clicks because the theme creates curiosity. Most ad platforms read the higher CTR and push more delivery to that creative, which pulls impressions away from concepts that get fewer clicks but hold users or convert them to payers. CVR adds one more acquisition step, but it still ends near install. A user can click, install, open once, and disappear, and the creative still gets full credit for the conversion.
So a full-funnel unit of analysis matters for ad creative testing. The unit is the creative and the cohort it acquired, connected through retention, payment, and LTV. Creative analytics should answer one concrete question: what happened to the users this asset brought in? A front-end report only covers the first step of that journey.
How should creative testing connect clicks to user quality?
The first move is to join creative-level ad data with in-game or in-app behavior.
Each creative needs a lifecycle record that ties CTR and CVR to D3 retention, D7 payer rate, and LTV. The join depends on attribution: every acquired cohort keeps the creative identifier that generated the install, and retention and payment events flow back to that identifier. The record then shows whether a creative attracted active users, paying users, or short-lived installs.
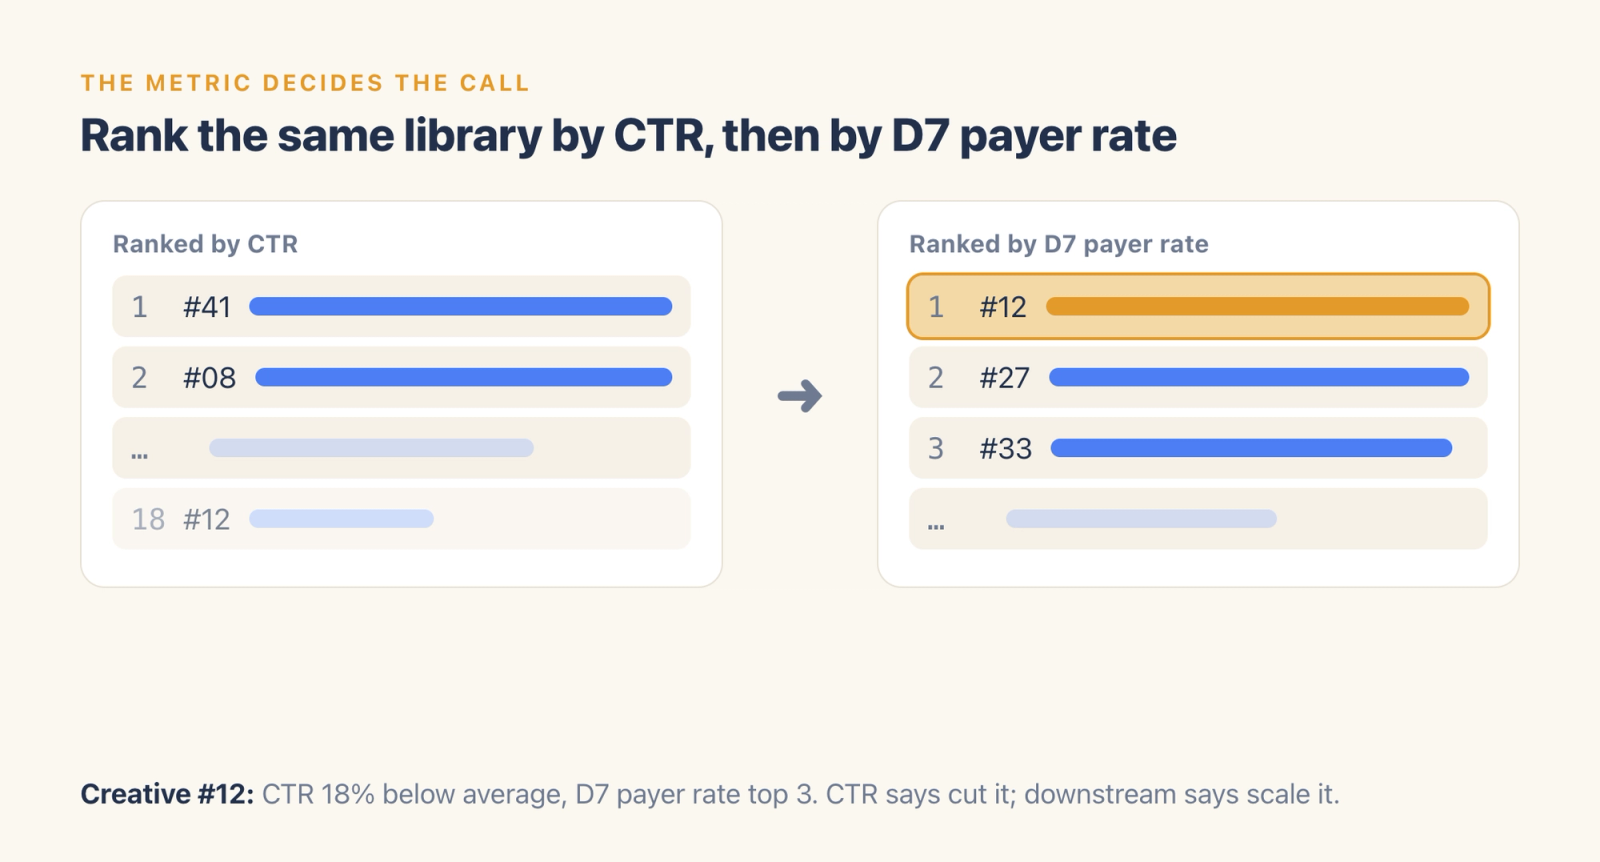
Take an illustrative case. Creative #12 has a CTR 18 percent below the library average, so a CTR-first review would cut its budget. The downstream view reverses that call: Creative #12 ranks in the top three for D7 payer rate across the whole library. Its gameplay format draws fewer initial clicks, and the users who do click show stronger payment behavior. The right next step is to recommend scaling it and testing new channels. A buyer reviews the evidence, checks the budget exposure, and approves the test.
The metric hierarchy follows the business model. An IAP game weighs payer rate and per-user LTV. An ad-supported mini-game weighs retained activity, because session depth creates monetizable inventory. The mechanism holds either way: link each creative to the behavior that produces revenue.
How do you catch creative fatigue earlier?
Creative fatigue usually shows up as a gradual trend, and weekly review compresses that trend into isolated snapshots, so a small repeated decline looks like routine variance.
A static alert waits for a large move inside one reporting period. A lifecycle view reads direction and persistence instead, which is what catches slow ad fatigue: repeated small losses can accumulate while every single movement stays under a normal anomaly threshold. Early detection also lowers the cost of the fix. A buyer can pause exposure, watch the next cohort, or test a refreshed variant while the decline is still small. Waiting for blended ROI to fall means the signal has already passed through spend, acquisition, retention, and monetization.
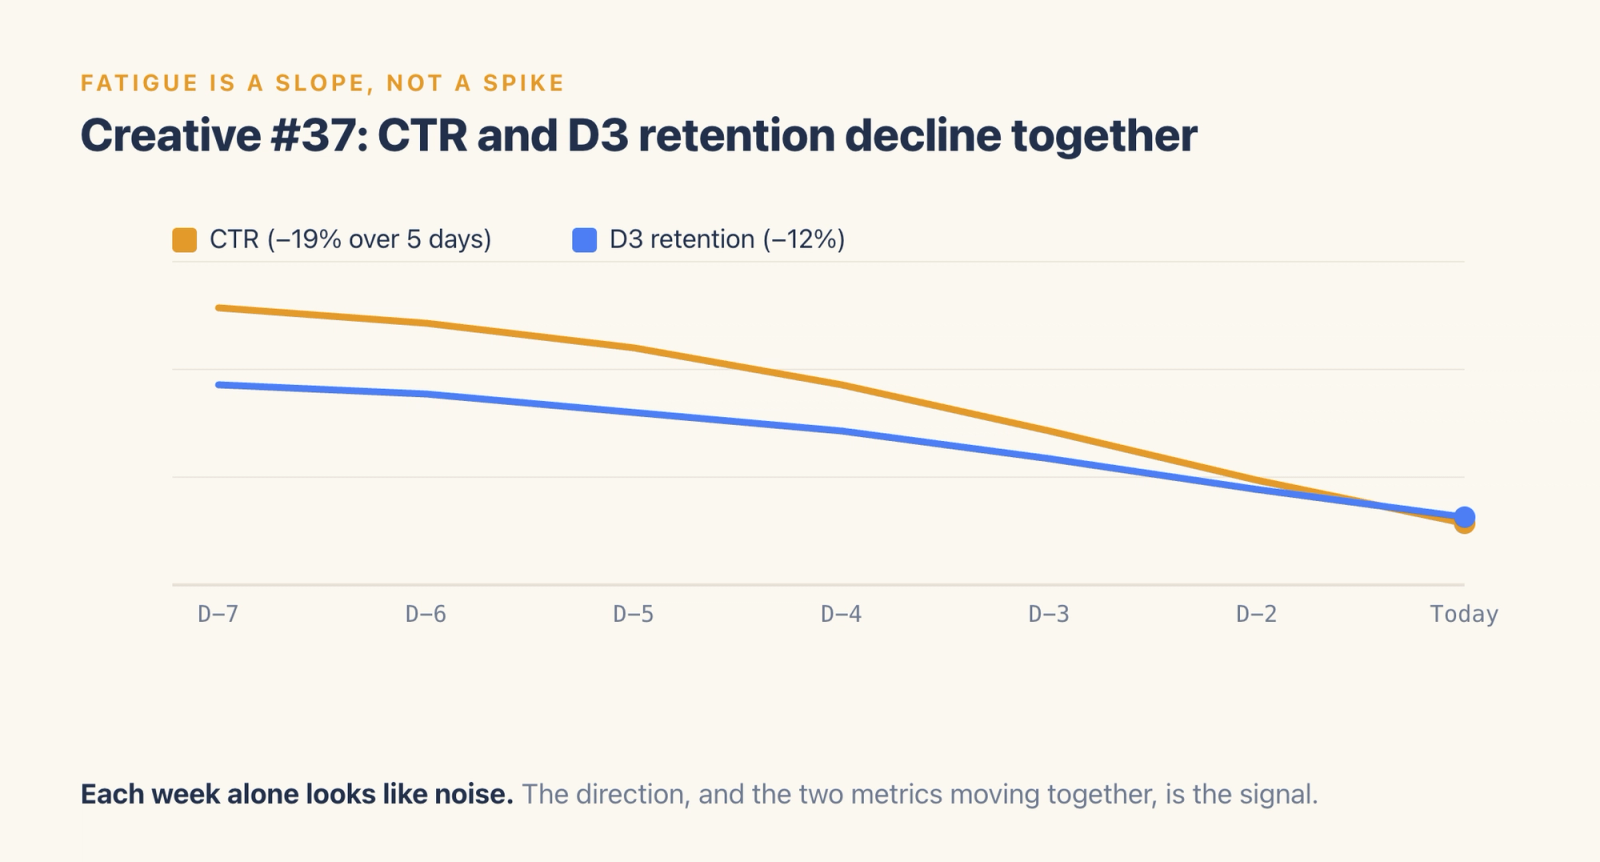
Consider Creative #37, again illustrative. Its CTR falls for five straight days, down 19 percent in total, and its D3 retention is off 12 percent over the same window. Either metric alone leaves room for other explanations. CTR could fall because the audience has seen the asset too often; D3 retention could shift because channel traffic changed. Moving together, they point to a creative lifecycle problem, because acquisition response and post-install quality are weakening at once.
The agent surfaces the pattern with a "pause and watch" recommendation and attaches both reasons. The buyer checks channel mix, recent edits, and spend concentration, then decides whether to pause, refresh, or keep testing. A day-one signal gives the buyer an earlier observation point, with confirmation coming from later cohort data while the buyer still controls the exposure and approves any budget change.
How does full-funnel data guide the next production brief?
Creative performance data can shape the next batch once assets are grouped by direction: story-driven concepts, gameplay recordings, live action, CG, and creator remixes.
The mechanism is aggregation. Any single asset can vary because of hooks, edits, audiences, or channels. Grouping by direction shows whether a format repeatedly produces stronger retention or payer behavior across many executions. That closes the loop between UA and production. The creative team gets evidence about the users each direction attracts, then applies it to scripts, openings, formats, and channel plans.
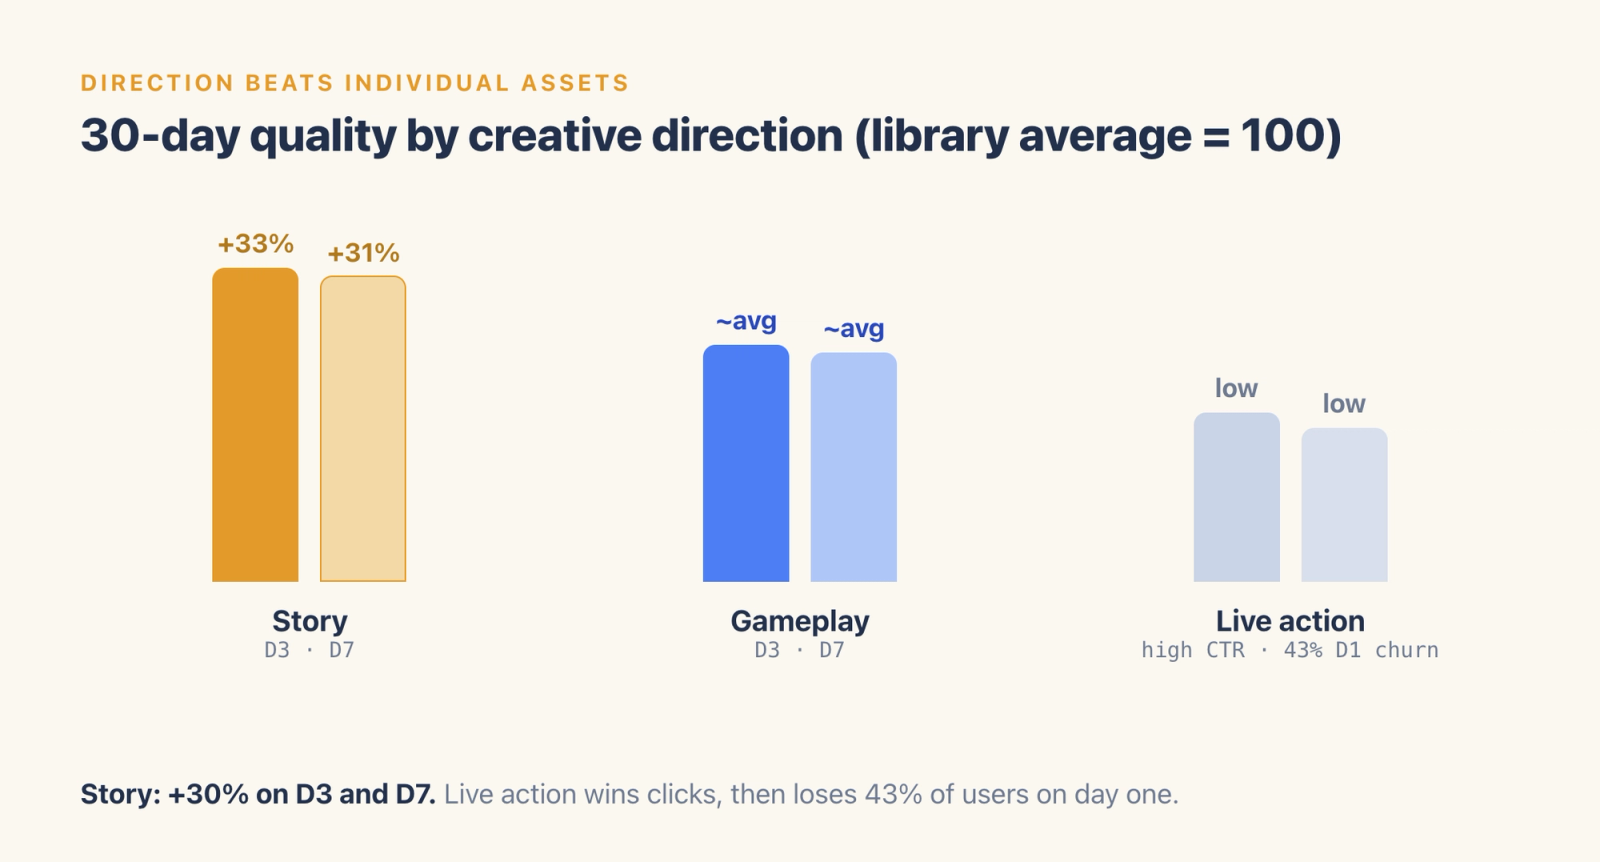
In an illustrative 30-day comparison, story-driven creatives beat the library average by more than 30 percent on both D3 retention and D7 payer rate, and within that direction a "comeback + twist" format posts the highest CTR on TikTok. Live-action creatives lead on CTR, yet 43 percent of the users they bring in churn on day one, well above the story format. Those results support two recommendations: expand testing around the story format, since it pairs response with downstream quality, and cap live-action exposure, since its click advantage comes with heavy day-one loss.
A person still picks the scripts, the production budget, and the launch plan. The data narrows the brief by showing which direction has produced stronger cohorts and which format concentrates spend among users who leave early. The team can ask one specific question before the next shoot: which direction has generated retained users and payers during the current lifecycle window?
What should the agent handle, and what stays with you?
A buyer running a hundred-plus creatives across four or five channels cannot inspect every lifecycle curve by hand. CTR and CVR sit in ad systems; retention and payment sit in the game or app. Every recommendation starts with joining those records.
An agent can carry that legwork. It can join front-end metrics with retention, payer, and LTV data at the creative level, monitor each creative's trend across channels, and surface combinations a buyer would otherwise miss: declining CTR paired with declining D3 retention, or a low-CTR creative with a top D7 payer rate. It can compare creative directions on downstream cohort quality and draft recommendations such as "pause and watch" or "scale and test," with the supporting metrics attached.
The decision stays with the buyer. A person reads the context the data does not capture: campaign constraints, production timing, audience exclusions, and channel commitments. The buyer then approves, edits, or rejects each recommendation before any change ships. The agent assembles the evidence and drafts the next action; the person owns allocation, approval, and execution.
What changes when creative testing follows users to LTV?
The operating model moves from isolated CTR review to creative-level ROI, and each move fixes a specific failure:
- Full-funnel attribution shows whether clicks become retained users and payers.
- Lifecycle monitoring catches creative fatigue through sustained direction and correlated metrics, days earlier than a weekly report.
- Direction-level analysis tells the production team which concepts generate stronger cohorts.
- Agent-assisted review gathers the signals and drafts the recommendations, while the buyer decides what gets budget.
CTR becomes one piece of evidence. Retention, payer rate, and LTV show where the acquired users actually landed, which is the difference between buying faster and buying better.
Get the whole white paper

This article is one use case pulled out of the Agentic Engine white paper, where creative lifecycle management is chapter 8. The chapter carries what a blog post has to leave out: the creative decay thresholds, the full lifecycle dashboard, and the IAP mini-game case that went from gut-feel pausing to data-driven creative decisions, plus a real customer case with what changed and what it cost.
Fourteen chapters cover the same ground for user acquisition, live operations, monetization, data engineering, and player support teams. Every one of them keeps a person at the approval step.