Most product teams can pull last week's signup count quickly. What those people did after signing up is often a harder question to answer.
Behavioral analytics is the practice of studying what people do inside a product: which actions they take, in what order, how often, and what happens after. The same term also names a different field. Security and fraud teams use it for tools that watch account activity for unusual behavior. This piece is about the other meaning, the one product and growth teams use to understand their own users.
What is behavioral analytics?
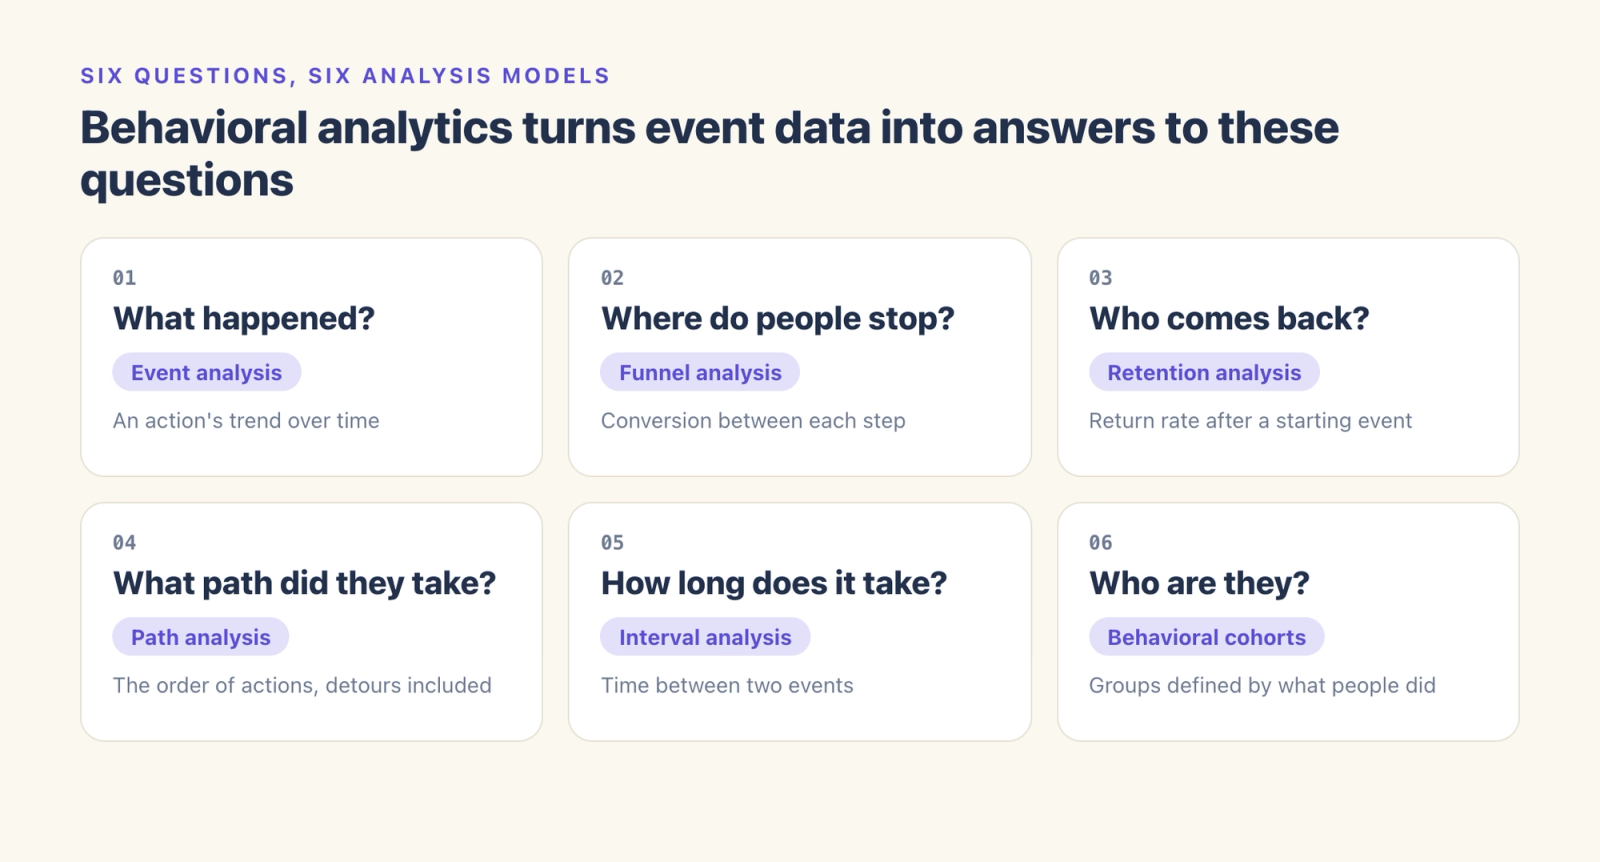
In this guide, behavioral data means a record of events. Someone did something, at a moment in time, with a few details attached: a user opened the app, viewed a screen, added an item, hit a paywall, closed the session. An event usually carries a user or device ID, a timestamp, and a few properties, such as which screen, which item or which price tier.
Behavioral analytics is the work of counting, ordering and comparing those events over time. A count of visits shows that traffic arrived. Analyzing the events shows what happened once it did: which screen came next, where the sequence broke, who came back a week later. Put plainly, behavioral analytics means studying events to learn what people do, where they stop, and who returns. People also search for this as customer behavior analytics when they want to know how customers use a product.
What happened?
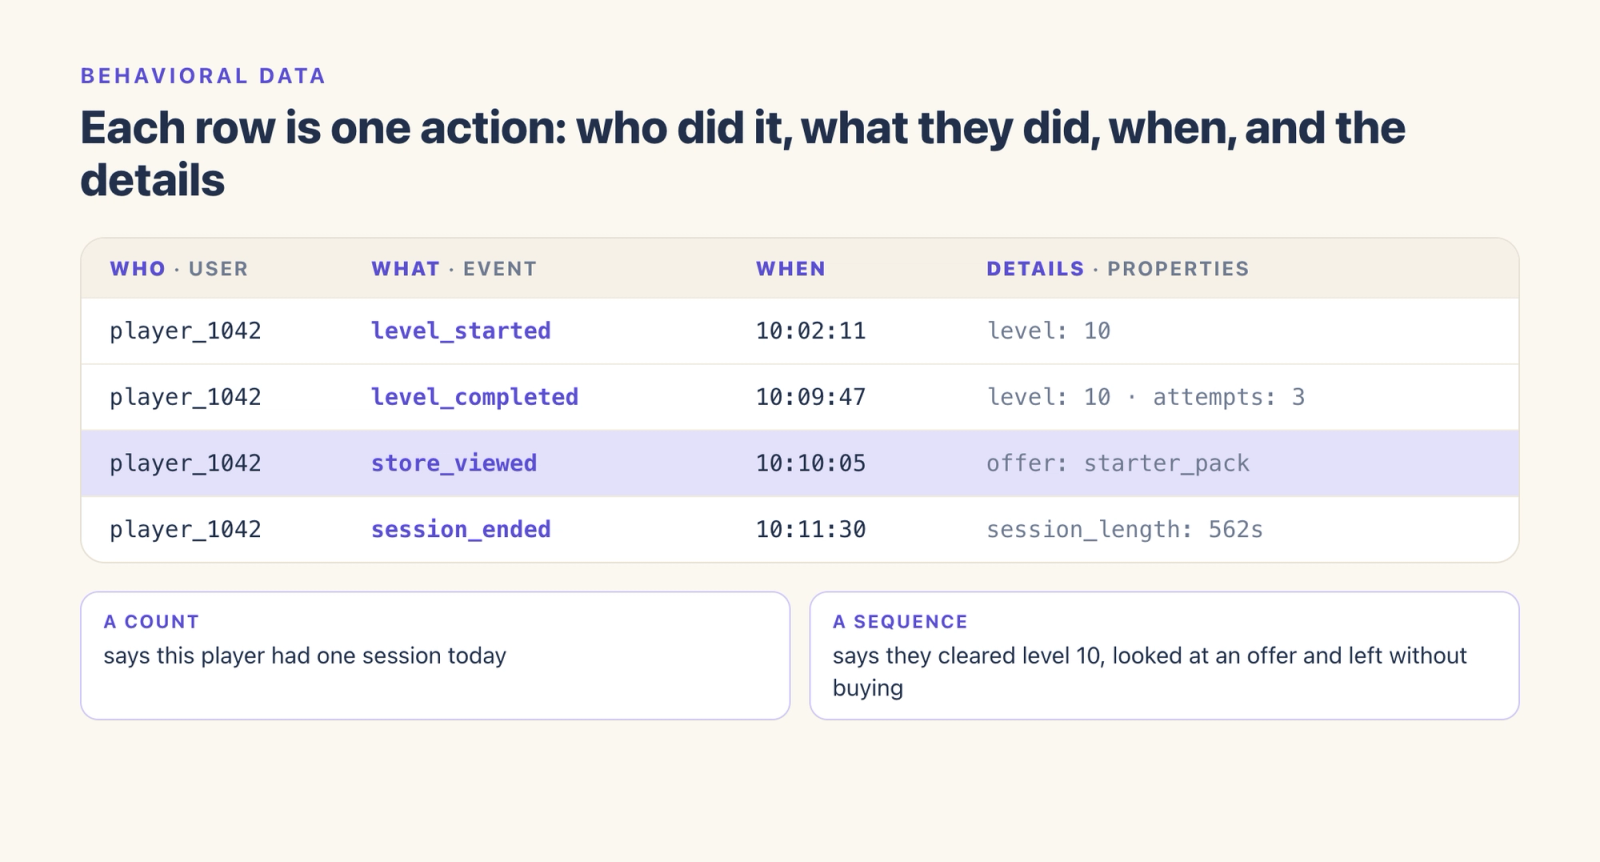
The simplest question is whether an action is happening more or less than it used to. Event analysis filters, groups, and aggregates the raw events into a behavioral metric, then charts it a few different ways. It can be where a question starts: you notice a rate moving, then go looking for why.
Where do people stop?
A signup flow, a checkout, an onboarding sequence: any multi-step process has a conversion rate between each step, and a step where the largest share of people drop off. Funnel analysis measures both, for up to 30 steps by default, with a conversion window anywhere from one minute to 180 days. That covers a checkout that takes minutes and a decision that takes months. A mobile game team might build a funnel from level start to level complete to first purchase, then find the step where the most players drop out.
Who comes back?
Retention analysis starts from one event, such as a first app open, and measures what share of those people come back and do a chosen return event a day, a week or a month later. A subscription app team might use trial start as the first event and a core action, such as playing a lesson, as the return event, then check how many trial users are still doing it by the day the trial would convert.
What path did they take?
Path analysis lays out the recorded order of actions people took, as a Sankey view of flows into and out of a chosen point. A funnel shows whether people reached step three. A path shows what they did on the way there and afterward, including the detours nobody designed for.
How long does it take?
Interval analysis measures the time between two events: how long between adding an item and buying it, or between a first session and a second one. It's the model that turns "people convert eventually" into a number you can plan a follow-up message around.
Who are they?
A behavioral cohort is a group defined by what people did, such as finishing a level or skipping a paywall. A game team might build a cohort of players who finished level 10 but never made a purchase, then look at what else is true about that group: how long they play and what else they have tried. To learn whether a message at that point changes their purchase rate, the team would run it as an A/B test.
What it isn't
Web traffic analytics is usually set up around sessions, sources and page views. That is useful for knowing where visitors came from. A session count on its own does not say what a visitor did once they arrived.
A typical BI dashboard reports on aggregated tables: totals by day, by region, by channel. It summarizes numbers that have already been rolled up, so the sequence of what one person or one cohort did across many separate events is usually gone by the time the chart is drawn. That sequence is what behavioral analytics is for.
And in security, where the practice is often called user and entity behavior analytics, teams watch account activity for signs of fraud. It is a real discipline, and a different problem from the one covered here.
Where it goes wrong
The funnel gets built, the drop-off gets found, the finding goes into a deck, and the deck goes into a folder. Everyone agrees it was a good meeting.
The other failure happens earlier: the tracking was not right to begin with. A funnel is only as good as the events feeding it. An event that was never captured, or was renamed in a release, can quietly break an analysis without an obvious error. Our post on data quality monitoring covers how to catch broken tracking early.
Our stance
An analysis that ends in a dashboard is half the work. We think it should end in a proposed action that a person signs off on: message the cohort that stalled at level 10, cut the step in the funnel that's losing the most people, run a variant on the paywall copy and see if the interval to purchase shortens.
In the Agentic Engine, you can ask the Analytics Agent a plain-language question, something like which players finished level 10 and never bought anything, and it answers from the underlying event data. The agent does the legwork of finding the cohort. A person reviews it, then uses the cohort in an engagement task, where guardrails apply to every send and an A/B test can compare more than one version of the message. A person approves what goes out. We wrote more about that split in what agentic analytics actually means.
For us, that last step is the point of a behavioral analytics platform: a finding becomes an action someone approved. Collecting the events is the start. We think the value comes from deciding to act on what they show.