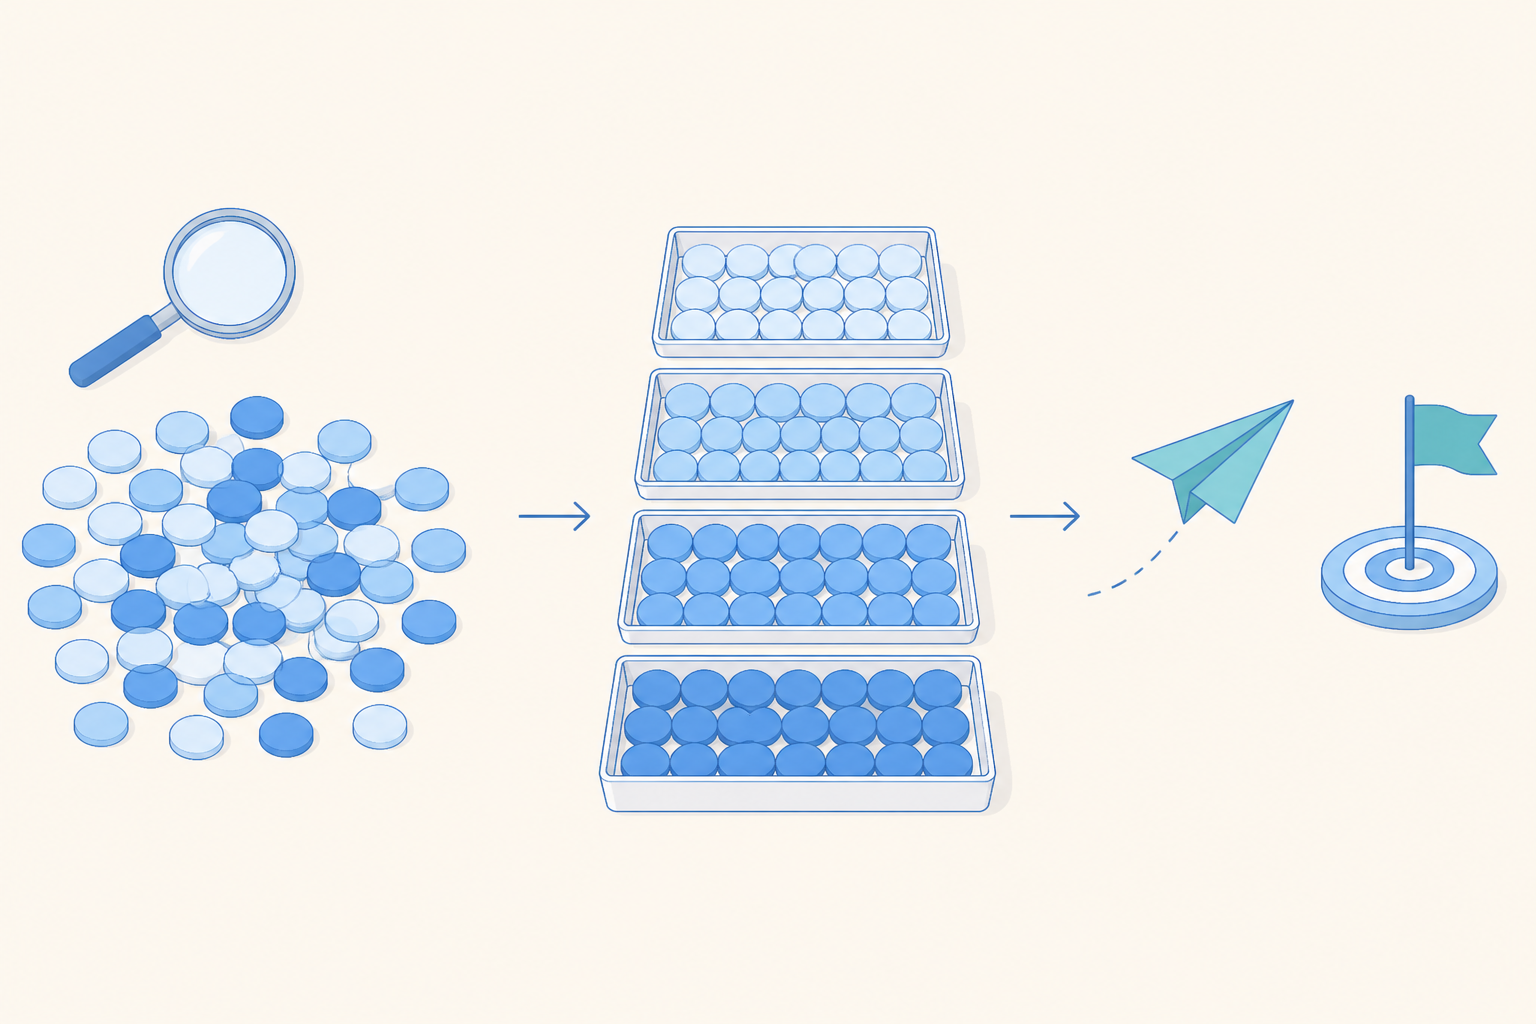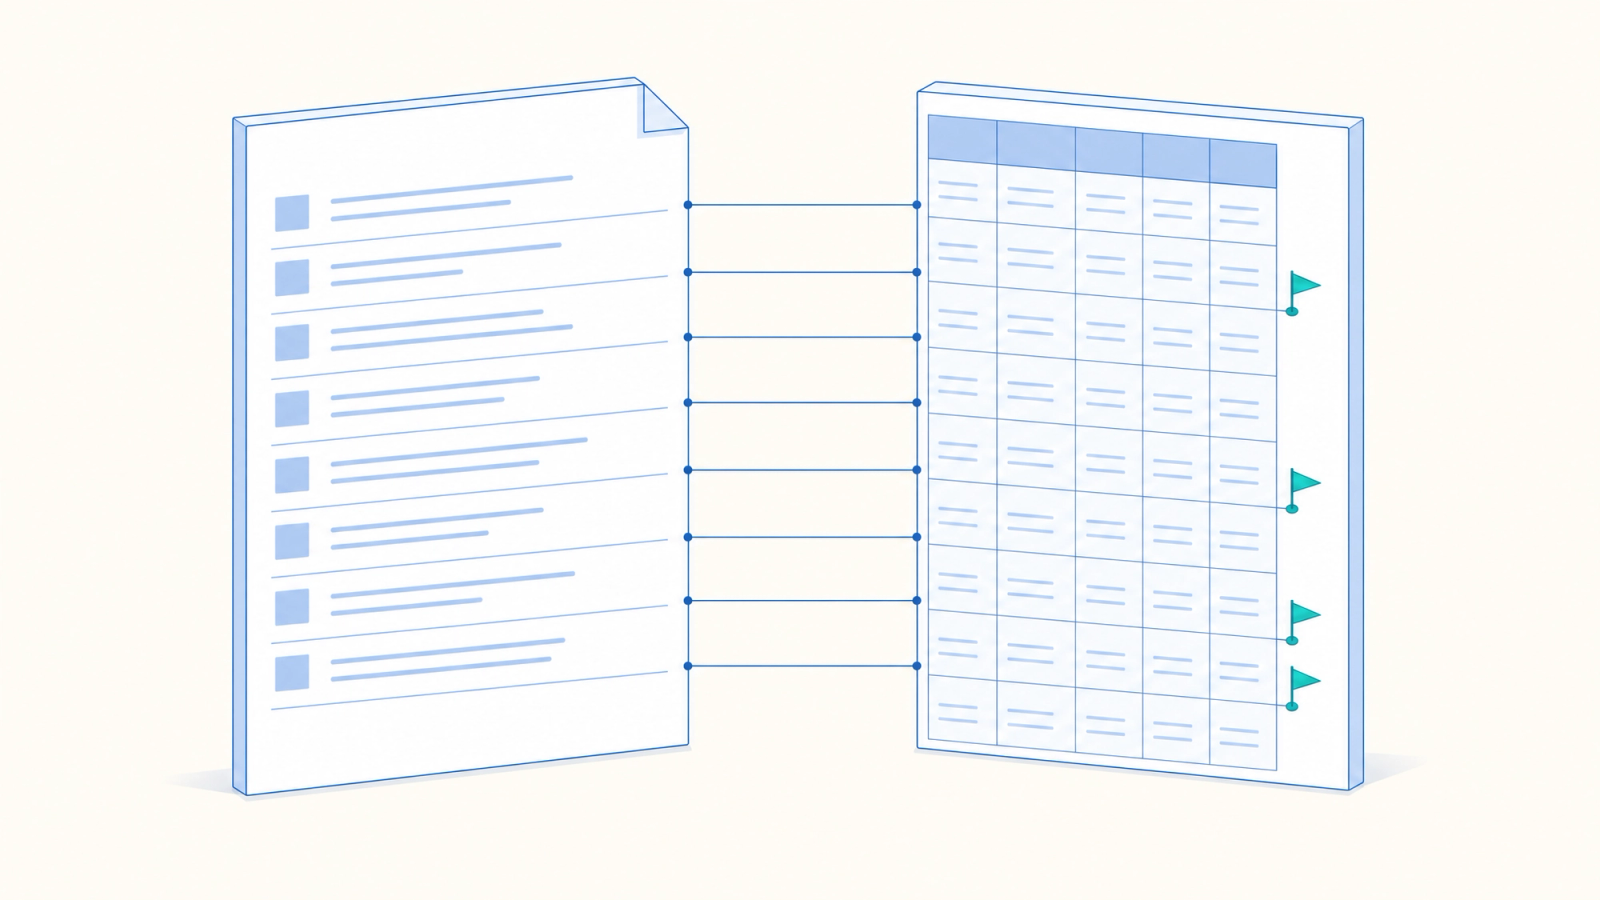
Data quality monitoring took one card battler's release check from two days to ten minutes. The method was unglamorous: compare the tracking plan against what actually landed in the warehouse, then trace every exception back to either a reporting path or a development task.
That single review surfaced four issues. Three payment events sent the amount as a string where the plan required a number. One campaign event was never reported at all. One property name was misspelled. One server field had an abnormal null rate. Developers fixed all four the same day, and QA spent about half an hour reviewing the flagged exceptions and approving the changes.
Why Tracking Breaks Between the Plan and the Warehouse
A release adds or changes tracked events. Product requirements describe what should happen, developers write the tracking code, and the data team checks what arrives. Every one of those handoffs is a place for the three versions to drift apart.
This studio shipped every two weeks, adding 20 to 40 tracked events per release, a dozen-plus parameters each. QA triggered every event by hand and compared the result against the plan. A full pass took two days, and it landed at the end of the release cycle when everyone was already tired.
Manual checking depends on somebody noticing a type mismatch, or a missing event, or that `charcter_id` is missing an "a". A field can look perfectly populated and still violate the plan.
The failure usually surfaced much later, when someone in ops opened a dashboard and saw a number that made no sense. By then bad data had been flowing for over a week, and it had already shaped campaign reporting and revenue analysis. This is why data quality monitoring belongs at the foundation rather than the reporting layer. Integration quality sets the ceiling on everything above it, and a report built on weakly typed properties inherits the defect no matter how correct its formulas are.
The Four Failures a Manual Pass Misses
A type mismatch that moves revenue. Three payment events sent `amount` as a string where the plan required a number. 4,200 records came in that way, and BI revenue came out roughly 15% off. The SDK returned a string, the developer passed it straight through, and nothing in the pipeline objected.
An event that never fires. `friend_assist` had been in the plan for seven days with zero records reported, while the campaign that depended on it had been live for three. Nobody had written it into the dev task board. It was confirmed in a conversation and never turned into work.
A typo. `charcter_id` could not join to user profiles, so profile match failure hit 100%. Events kept arriving the whole time, which is what made it invisible.
A null rate nobody was watching. `server_id` came back null 23% of the time against a historical average of 2%. Nulls do not change event counts and do not throw ingestion errors, so nothing alerts. The column simply stops meaning what analysis assumes it means.
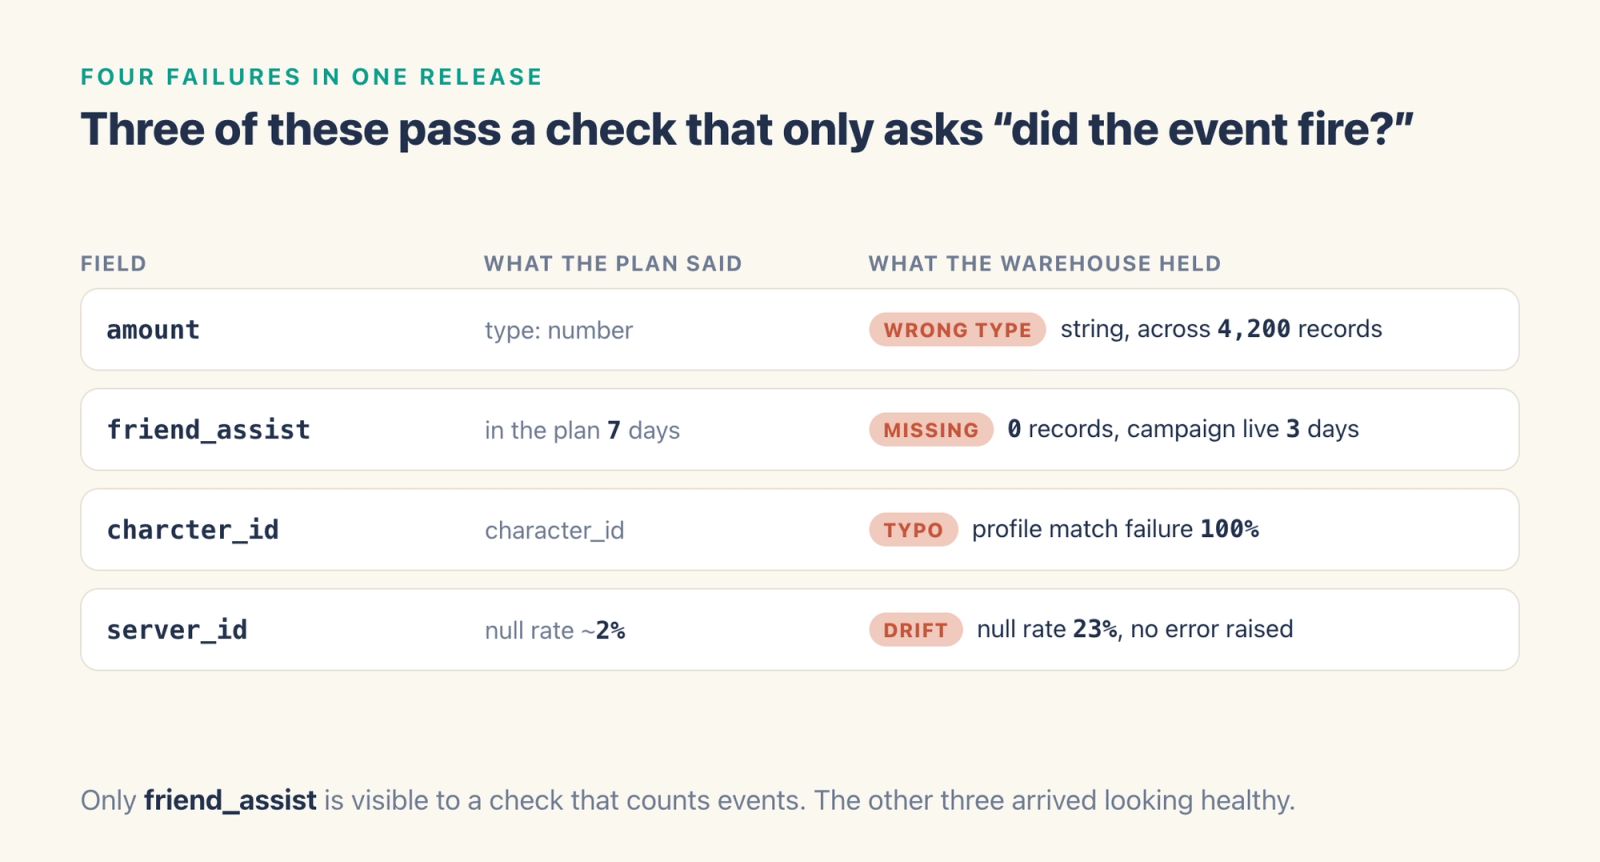
Three of those four are invisible to a check that asks only "did the event fire". That is the gap data quality monitoring closes.
What Data Quality Monitoring Actually Compares
The comparison itself is mechanical. Every planned event is checked against what reported. Parameter names and types are checked against the plan. Required fields are checked for completeness. Distributions are checked against their own history, which is what catches the null rate.
On a clean run for release v3.2, all 12 events registered and reported. `event_value`, `platform` and `app_version` were non-null at 100%. The payment events summed to 44,188.59 across a mean of 253.96, which by itself proved no non-numeric values had slipped in.
An all-green run still leaves judgment calls. That release flagged platform values of Windows and MacOS on a mobile game, which is either emulator traffic or a distribution channel nobody documented. A report can tell you the distribution looks unusual. Deciding whether unusual is wrong is still a person's job.
Three other questions came out of the same clean run and none of them had automatic answers. Whether the sample window held enough volume to trust. Whether the payment amounts were denominated in dollars or cents, since both parse as valid numbers and only one of them is right. And whether `event_value` should stay locked to a numeric type permanently, which is a decision about the plan rather than about this release.
That is the honest shape of this work. The comparison is exhaustive and fast, and it converts a two-day search problem into a short list. The short list still needs somebody who knows the product to read it.
Tracing the Cause Behind the Exception
Finding the exception is the easy half. The payment mismatch traced back through four steps: the requirement wording, the developer's type choice, the SDK's return type, and finally the BI metric definition that consumed it. The missing event traced to something more ordinary, a verbal confirmation that never became a task.
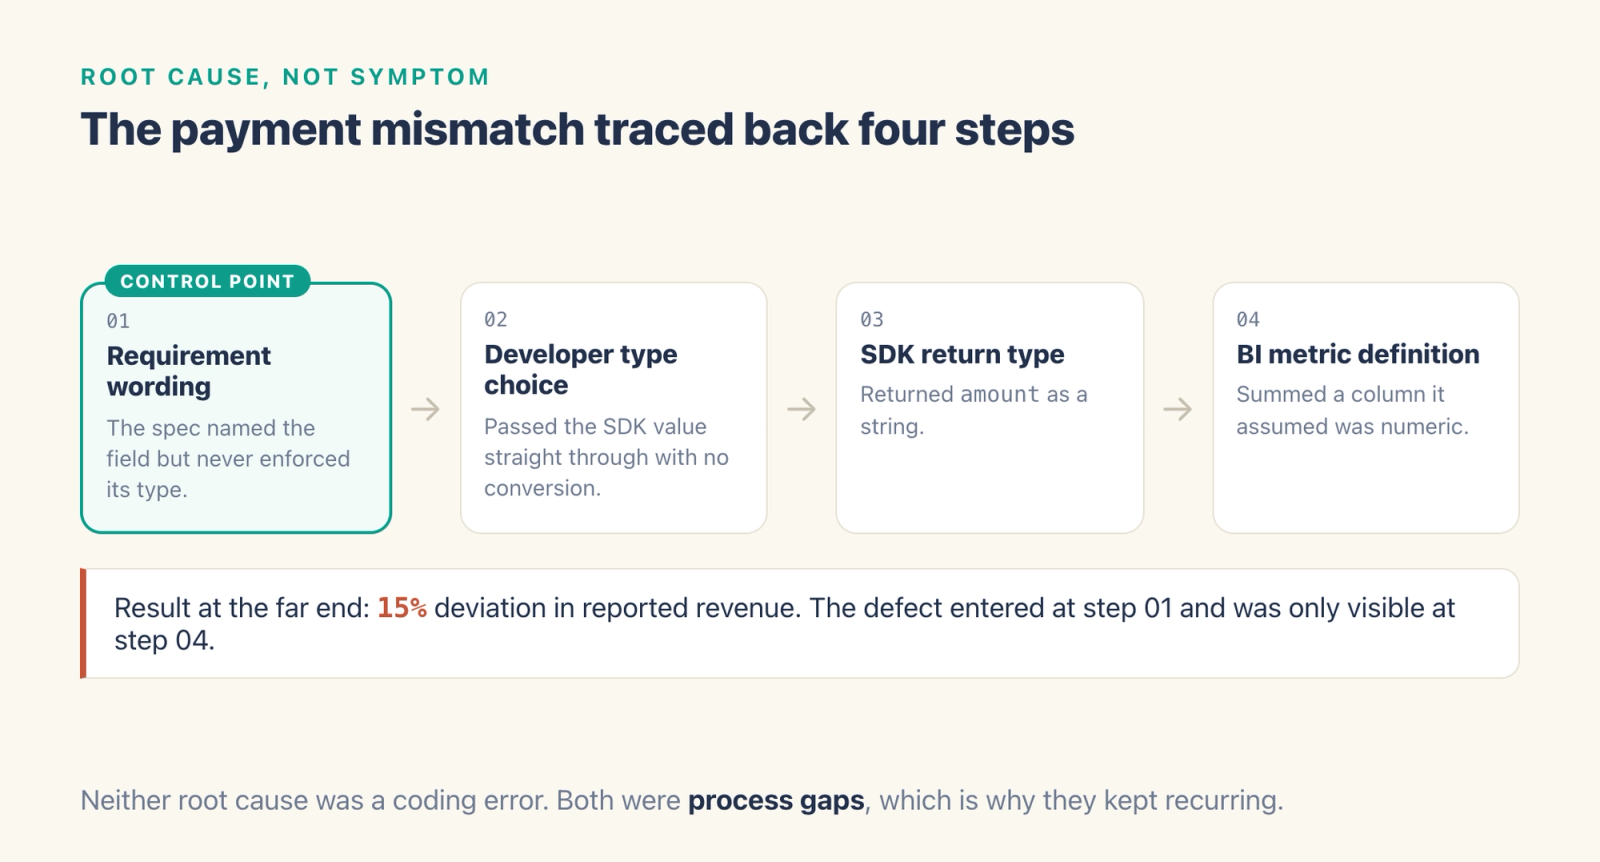
Neither root cause was a coding error. One was a missing type check between spec and implementation. The other was a missing sync between agreeing on a requirement and assigning it. Those are process gaps, and they keep producing new incidents until somebody changes the process.
This is the part that makes data quality monitoring worth running continuously instead of once per release. A single validation pass finds the four things wrong with this build. A validation pass that runs every day, against a plan that now enforces types, stops the same four categories from recurring. The first is a fix. The second is a control.
That is why the fix here was not only a faster check. Quarterly manual audits became daily automated ones, and type enforcement moved into the spec itself.
What Data Quality Monitoring Changed for This Release
For v3.2, validation went from two days to ten minutes. The instrumentation quality score, scored automatically by the platform against the plan, moved from 62 to 96. BI revenue deviation fell from about 15% to 0.3%. Metric definition incidents for the release came in at zero, against a historical average of two to three. QA manual investigation effort dropped by about 90%, and that time went back into functional testing.
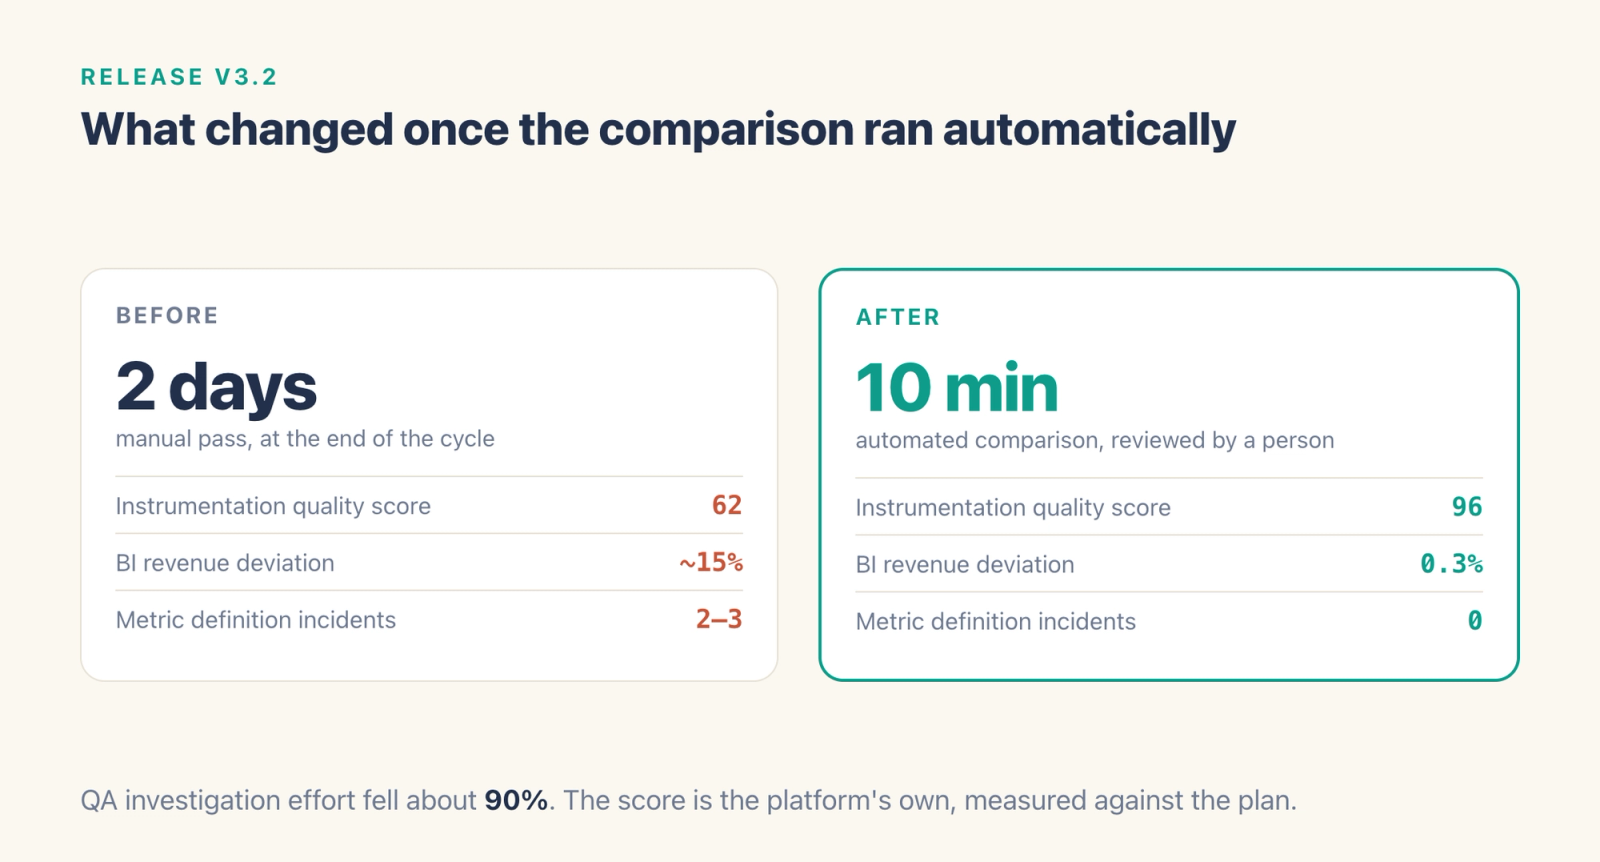
The more durable change is where the work sits. Two days of checking at the end of a cycle became ten minutes at the start of a conversation, which means instrumentation problems get caught while the release is still being decided rather than after it has shipped.
The Boundary
The agent runs the comparison, checks types and completeness against the plan, traces likely root causes, and drafts the fix list. It does not decide anything. A person reviews the flagged issues and approves the fixes. The same person owns the switch to the corrected build and ships it.
That distinction matters more as the checks run more often. A daily automated check that also had authority to change instrumentation would be a new source of incidents. A daily check that produces a reviewed list, and a named person who approves it, is a control.
At ThinkingAI we build data quality monitoring on that boundary. The tracking plan and the warehouse are two datasets owned by two teams in two systems, and keeping them honest against each other is exactly the kind of work worth automating. Deciding what to do when they disagree is not.
Get the whole white paper
This article is one use case pulled out of the Agentic Engine white paper, where release instrumentation validation is chapter 1. The chapter carries what a blog post has to leave out: the full validation report for all 12 events, the parameter-level type and null-rate checks, the root-cause attribution chain, and the process changes the team adopted afterward.
Fourteen chapters cover the same ground for user acquisition, live operations, monetization, data engineering, and player support teams. Every one of them keeps a person at the approval step.