
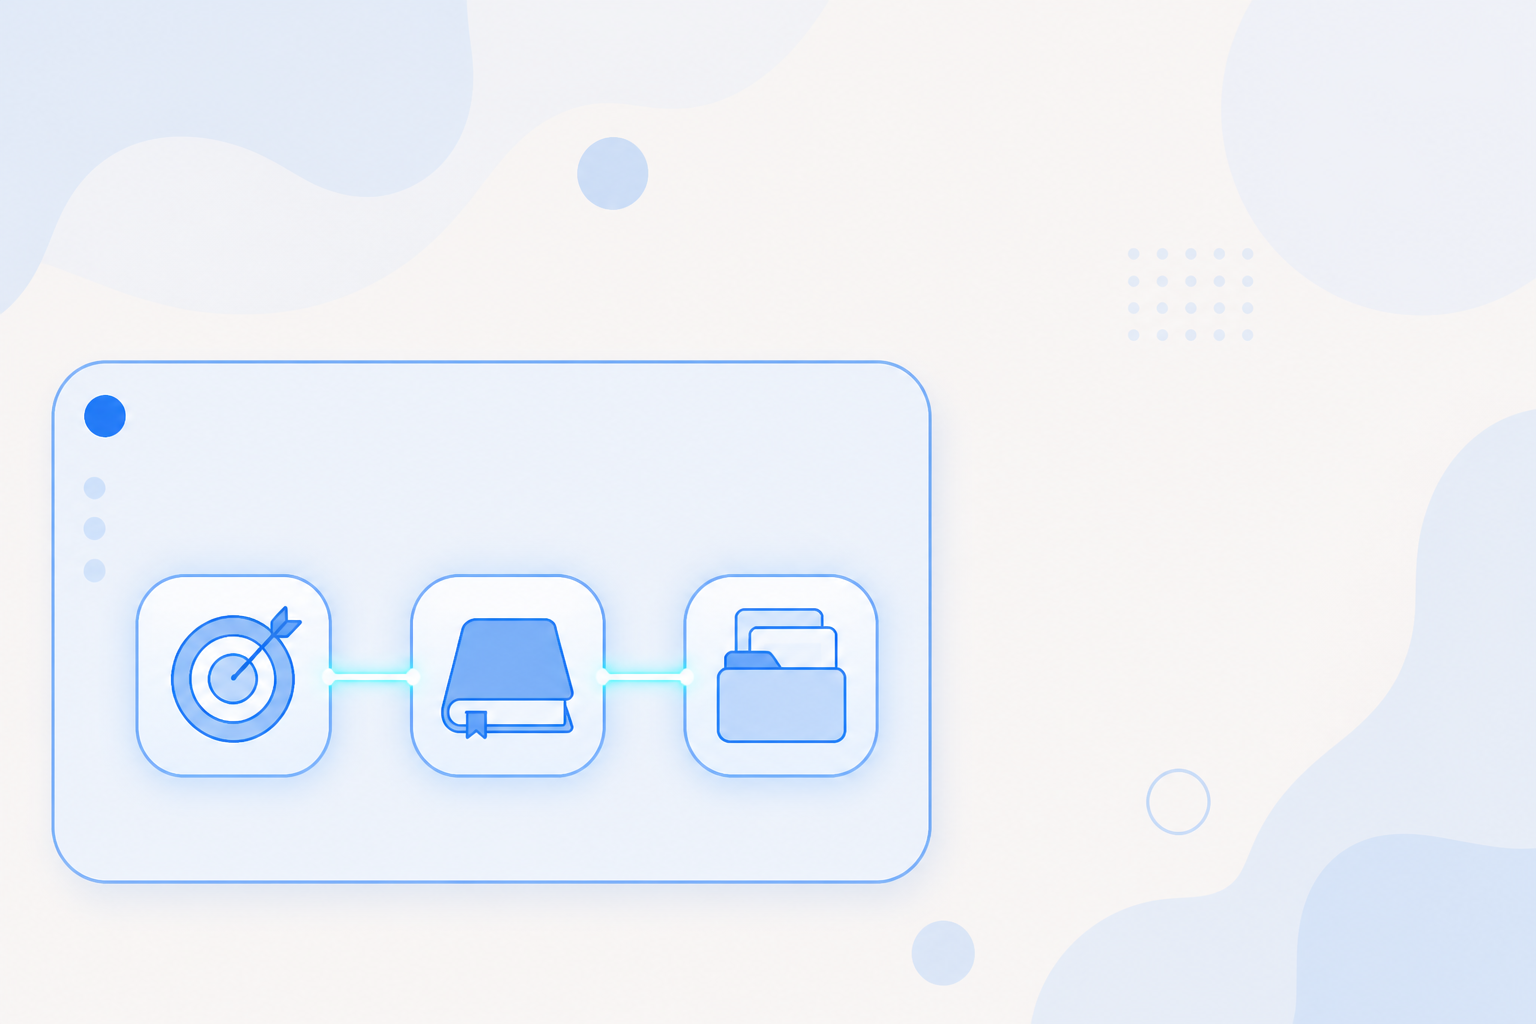
You can now see what your agents do after the user hands them the task. Agentic SDK is a new observability layer for the agents you embed in your own app, whether they run in the cloud or on the device.
For ten years, product analytics has watched the user side: what people tapped, which path they took, where they left. An embedded agent adds a second layer that sits underneath all of that. It calls tools, follows a reasoning path, spends tokens, and sometimes fails one step of many. All of it happens inside your app, and user-behavior analytics never sees it. When that layer is dark, you cannot tell whether the agent is doing a good job, where the cost is going, or which step to fix.
What Agentic SDK captures
Agentic SDK reads the runtime an embedded or on-device agent leaves behind: the call trace, the timing, and whether each step succeeded or failed.
It covers the moments that matter in an agent's work:
- Agent registration and startup
- Skill execution, where a skill is the unit of work an agent performs
- Tool calls, both MCP and local tools
- Agent-to-agent (A2A) coordination, when one agent hands off to another
- Sessions inside an embedded UI
This is the range it records. What you do with that record comes later.
How it works: one task, one trace
A single agent task passes through a few layers. Intent catches what the user said and pulls out the parameters. A skill runs the actual work. Tools, whether MCP or local, get called along the way.
Agentic SDK ties all of it together with one trace_id. Every call in the same task hangs off that id, so you get a call chain with real hierarchy instead of scattered lines in a log. Each step is paired automatically into a complete event that carries its own timing and its own success or failure.
The payoff is simple. You do not stitch loose logs back together by hand. You follow one chain and watch the whole task, start to finish.
Agent behavior meets user behavior
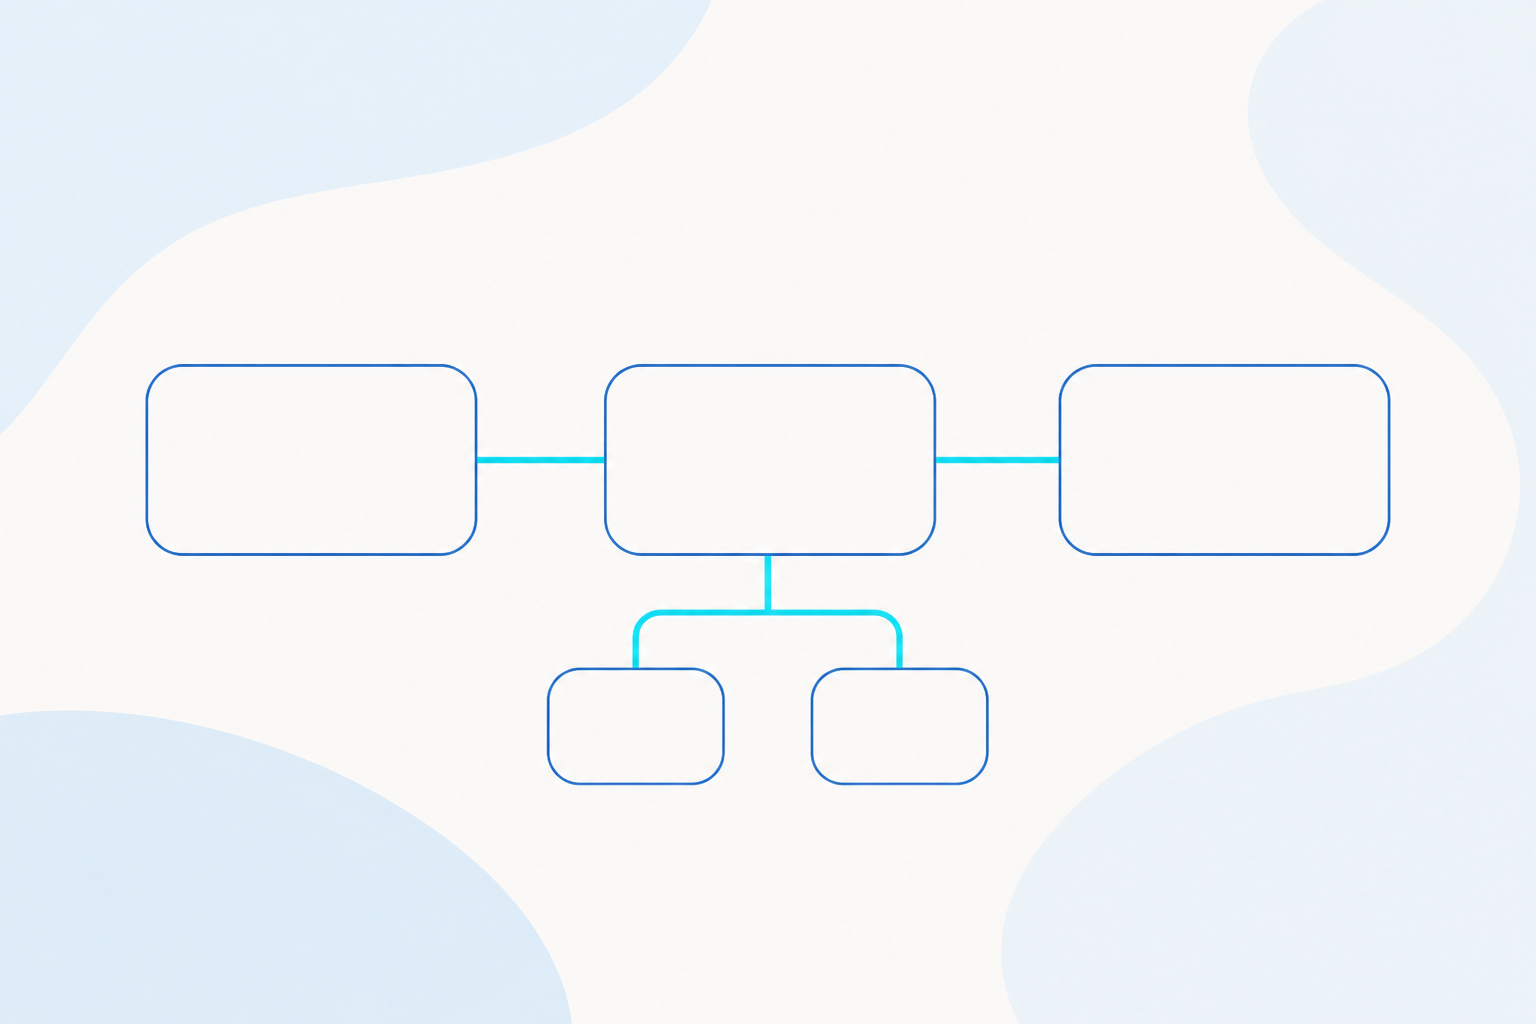
The same SDK holds both sides: the user-side behavior and the agent-side runtime, aligned on the same session.
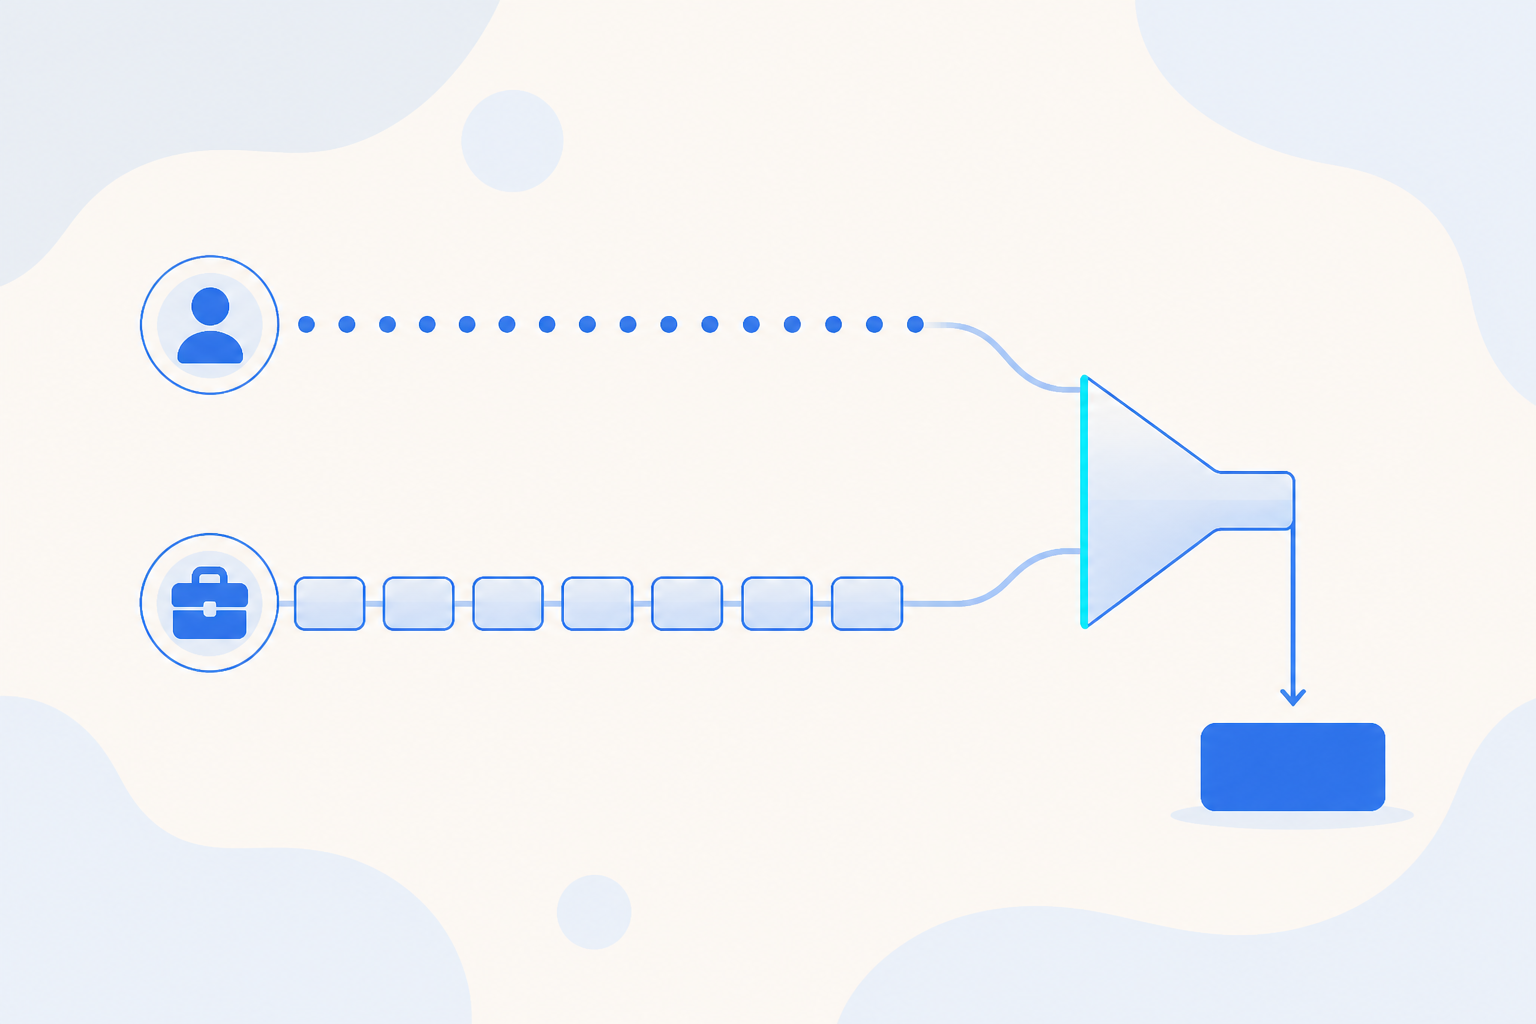
Read down one session and the story is continuous. The user asks for something. The agent runs some skills, takes a path, spends some cost. The task finishes or it does not, and the user stays or leaves. User side and agent side land in the same analysis funnel.
Why it matters: you get retention, funnel, and cost conclusions you can act on, without laying down a separate set of manual events to connect the two halves.
Built for production: low-touch and private by default
Agentic SDK is meant to go into a real app without a rewrite.
- Low-touch integration. It wraps the interface boundaries the framework already exposes, so it does not change the framework itself. Bringing one module in is a small change. There are three ways to connect, from a quick check to a production rollout, and the lightest one is close to no code.
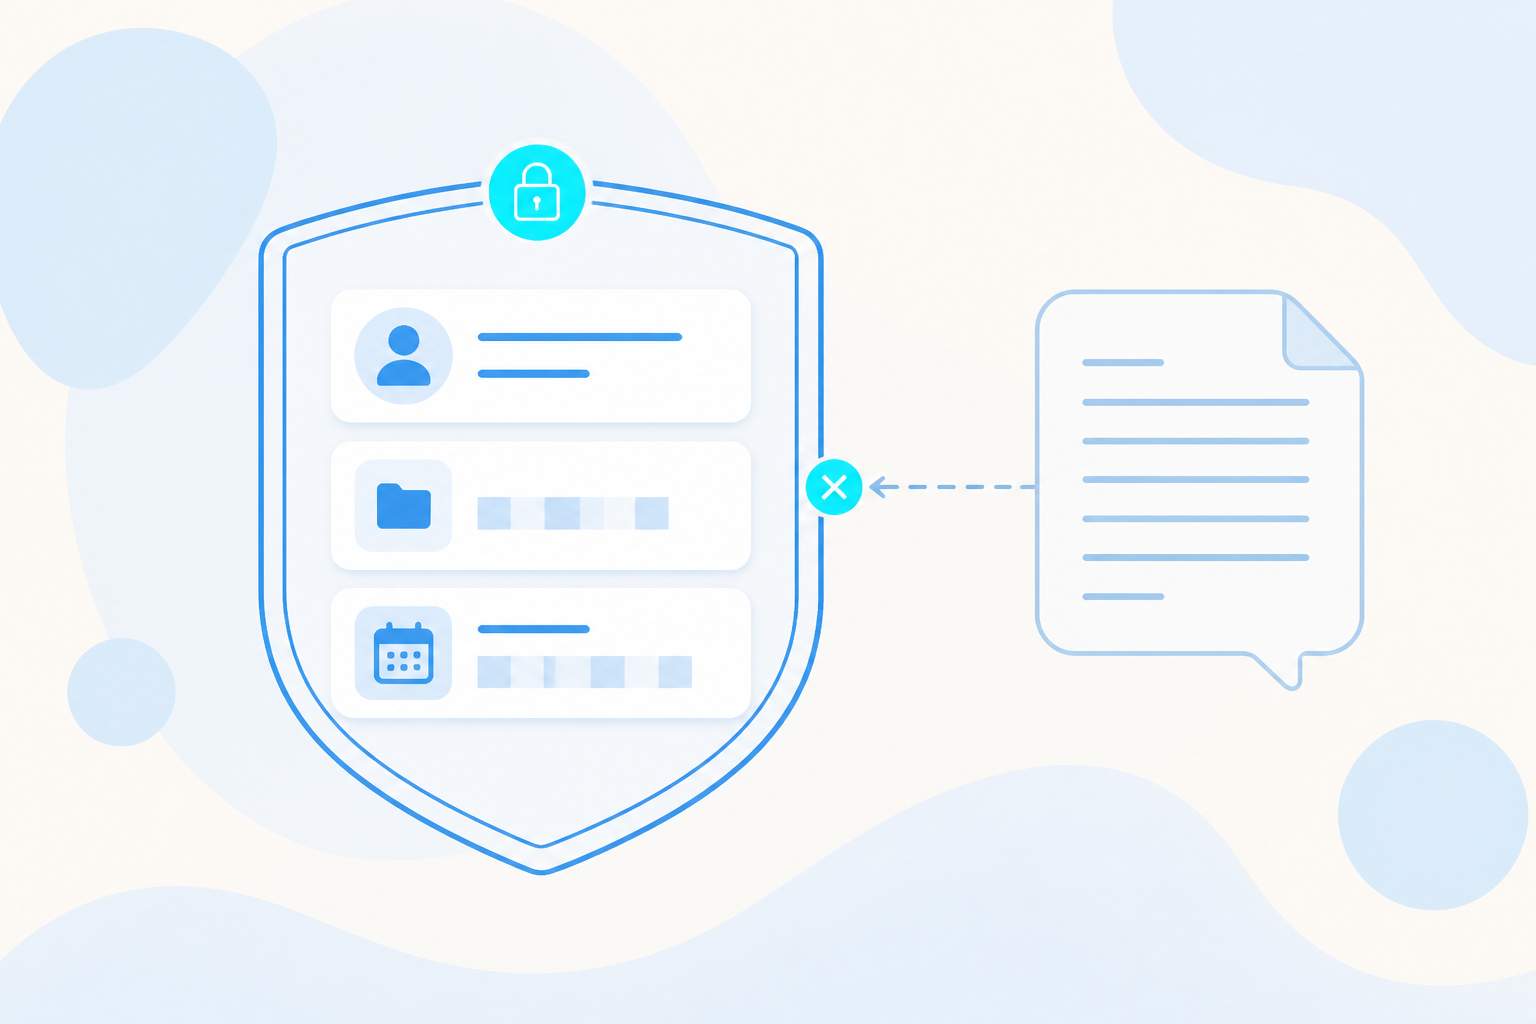
- Private by default. It does not report raw user conversation content. It records structured runtime facts only: which tool ran, how long it took, whether it worked. Sensitive fields are masked automatically, over-long values are truncated, and users can opt out of collection.
- Isolated and self-healing. The collection layer is kept separate from your agent's own work. If collection itself has a problem, it steps down on its own and leaves the agent running.
- Self-hosted end to end. The whole path can run inside your own deployment, so the data never leaves your perimeter.
What you can do with it
- Replay a failure. When an agent goes wrong, replay the whole path. Which step went off, which tools it called, and the input, result, timing, and status of each one are all there. No log archaeology.
- Attribute cost. See how much was spent and where, counted by session, task, or scenario, so you can tell which feature and which kind of user runs up the bill.
- Follow the full funnel. Trace a user from the moment they ask to the moment the agent delivers, and see where people drop off and how many stay, end to end.
- Take it into operations (optional, planned). The same foundation can connect to A/B experiments and client-side triggered strategies, so a problem you find can be verified before you decide whether to roll it out.
Open outputs and getting started
The data has open exits. Send it to your own backend, a Webhook, or OpenTelemetry, or route it into Agentic Engine. Public cloud and self-hosted both work.
To start, take the lightest integration and prove it on a single module first. That path is close to no code, so you can confirm the trace looks right before you widen it. Once it holds, roll it into production. Deploy it in the public cloud or fully self-hosted, whichever your perimeter calls for.
Share