The number nobody wanted to sign
Picture the last time a growth loop actually got built. Someone wrote a tracking plan in a doc. An engineer wired the events a week later, working from a version of the plan that had already changed twice. A data person spot-checked the numbers and mostly trusted them. An analyst built a dashboard that measured a slightly different thing than the plan had intended. And an operations person, three weeks in, looked at a retention chart and had to decide whether to act on it, knowing that four people and four handoffs stood between that line and the product it claimed to describe. Nobody had lied. Nobody had done bad work. And yet the number on the board was the kind you hedge before you stake a decision on it.
That is the ordinary shape of a growth loop. Five roles, four handoffs, and the weeks disappear into the gaps between them. None of the individual jobs is hard. The cost is the seams. The plan drifts from the code. The events fire twice. The dashboard quietly redefines a metric. By the time anyone acts, the question is no longer what the number says. It is which version of the number this is.
We wanted to see what the loop looks like when one operator runs the whole chain instead of five. So we gave a single coding agent one job: take a test project from no instrumentation at all to a live re-engagement flow, and run every link in between. The agent did the typing. ThinkingAI's Agentic Engine did the rest. We stayed in the room, which turned out to mostly mean watching.
What one operator actually ran
The agent started where the loop starts, with a tracking plan. It read the project, worked out what the product actually did, and drafted an event and property table for the three things we cared about: registration conversion, content views, and form inquiries. Then it did something a hurried human usually skips. It noticed the site had no registration feature, and instead of inventing events that would never fire, it modeled the funnel around lead capture. It showed us the plan before uploading anything.
Instrumentation came next. Once we approved the plan, the agent added the SDK and every tracking call in one contained pass, previewed the insertion points before touching them, and ran a production build afterward to prove nothing broke.
Then the step teams skip and regret. Verification. The agent started a dev server, drove a browser through the real clicks, and checked each event against the plan as it fired, one at a time. Not an assumption that the numbers were right. Something closer to a person watching them arrive.
From there it turned definitions into something shared. It built a knowledge base from the tracking plan and the metric definitions and compiled it, so that every later question drew on one set of definitions rather than five people's memories of a meeting. When we asked what the registration conversion rate was actually measuring, the answer came back with its source cited, tied to the exact event underneath it.
Only then did it build the dashboards, from a sentence of plain English. We asked for a conversion overview with a thirty-day active-user trend, the registration funnel, and seven-day retention for new users. The agent mapped our everyday wording onto the real events, using the definitions it had just compiled, and wrote the mapping into each report so anyone could see how a number was assembled.
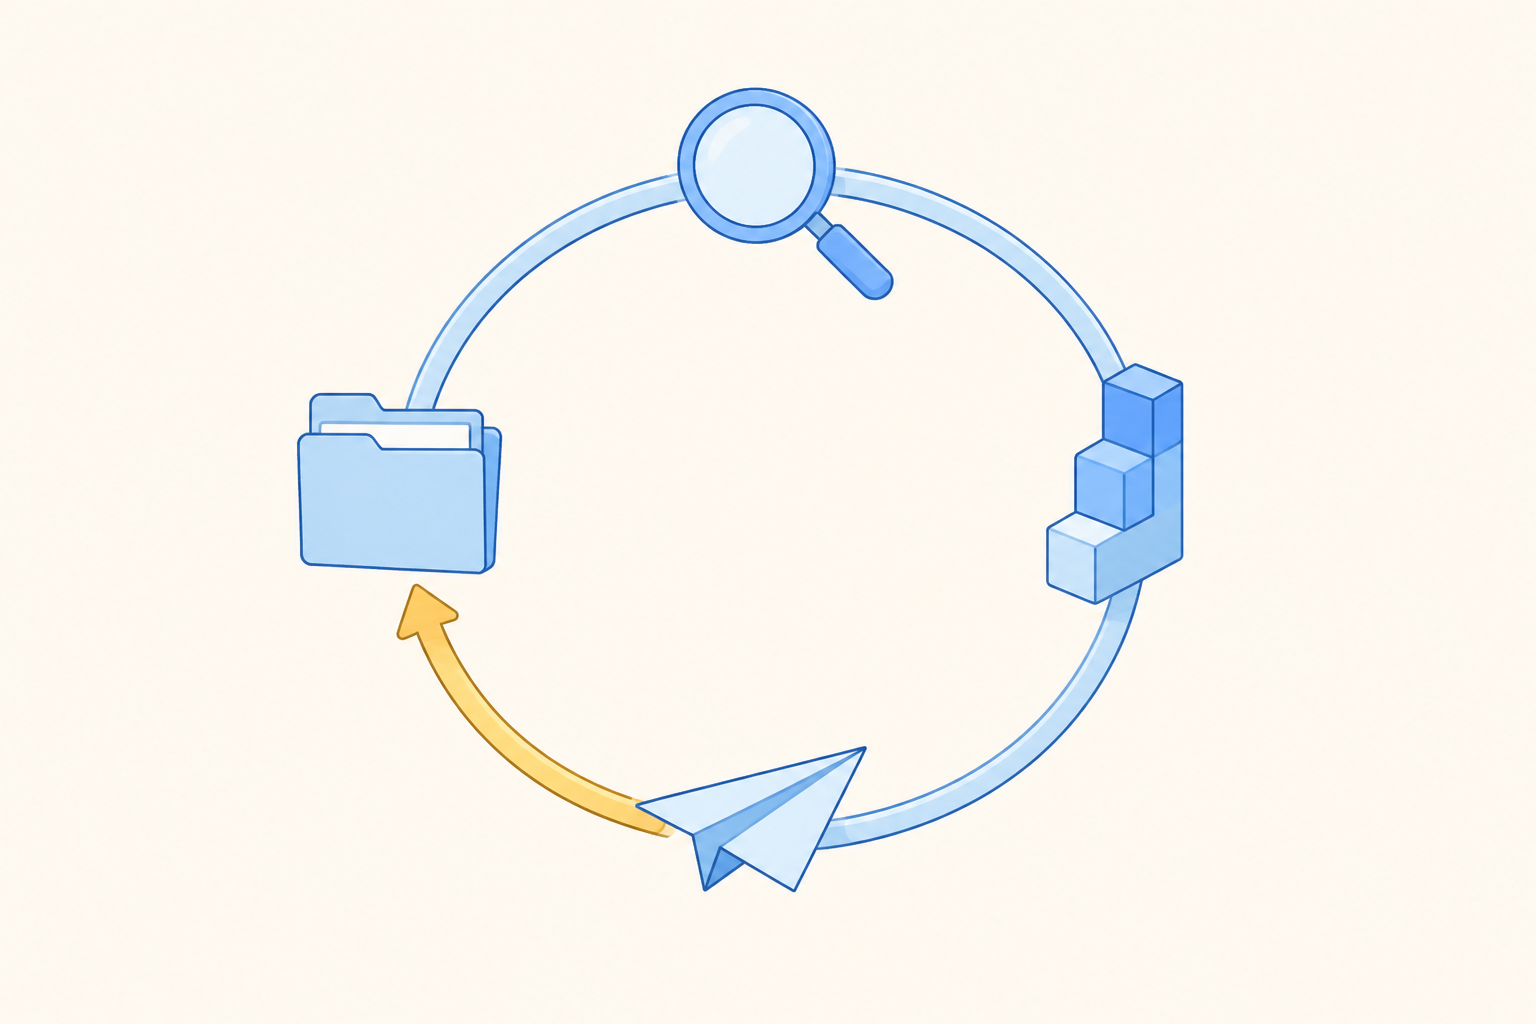
And then it closed the loop by acting. It selected the people who had submitted an inquiry in the last seven days but never registered, drafted the re-engagement message, and waited for us to approve the wording before anything ran. Then it built the flow, put it on a schedule, and wired the results back into the same dashboard. The people it reached, and whether they went on to register, flowed back to the board it had built two steps earlier.
That is the loop closing on itself. Detect, decide, act, and watch the result land in the same place you started looking.
The numbers were small, and they held
The point of running this on a real project rather than a slide was to see whether the output survived contact with real data. It did. The registration funnel came through clean: roughly 101 page views, 64 registration clicks, 21 submissions. About a sixty-three percent step down to intent, and twenty-one percent through to the finish. Seven-day retention showed up on the board as specified. And the re-engagement flow did the one thing that makes it a loop and not a report. Its results came back into the conversion overview, so the recall audience and their later registrations sat next to the funnel that had identified them.
Small numbers, because this was a test project and not a business we run. But every one of them traces back to an event the agent verified by hand, defined in a knowledge base with its source cited, and mapped into a report that shows its own arithmetic. That chain of custody is the whole difference between a figure you present in a meeting and a figure you act on afterward.
The agent is the hands, not the story
It would be easy to read this as a story about a clever coding agent, and it would be the wrong reading. Any capable coding agent could have been the hands. Swap this one for another and the loop still runs. The agent is interchangeable. What is not interchangeable is the layer it was standing on, and that layer is the part worth your attention.
Consider what the agent did not have to figure out for itself. It did not invent metrics from a blank page. The funnel shape and the retention window came from definitions already tuned to how this kind of business actually thinks, so the output matched reality instead of a generic template. It did not solve data collection either. Getting events in cleanly and lawfully is its own discipline, worked out over years and carrying the compliance that comes with it, and the agent instrumented against that foundation rather than rebuilding it. When it ran real code and drove a real browser, it did so inside a sandbox that reached production only after a person said yes, which is the only reason we were willing to hand it that much rope without holding our breath. The work ran where the spend stayed visible, so a loop like this is still affordable to run again next quarter. And every artifact it produced, the plan, the events, the knowledge base, the dashboards, the flow, sits in one place you can open and check, rather than scattered across five tools owned by five people.
Name any one of those and the agent looks less like the protagonist. The coding agent collapses five roles into one operator. The layer underneath is what makes that operator's output something a growth leader would sign.

Where the number gets signed
Go back to the retention chart nobody wanted to sign. What made it unsignable was never the analyst or the engineer. It was the four handoffs between them, each one a place where a definition could quietly change and nobody would notice. Collapse the handoffs into one operator, and give that operator a floor where every number keeps its receipt, and the chart stops being an argument you have to win. The tools changed. The person who has to answer for the number did not.