
ARPDAU (average revenue per daily active user) is one day's revenue divided by that day's active players. It moves when the share of players who pay that day changes, when those payers spend more or less, or when ad revenue per player changes.
Splitting ARPDAU into those parts shows where a gain is worth the most for your game. From there we go through the levers for each part, how to size a new revenue stream before you build it, and how to measure a lift with a control group. The numbers in the examples are illustrative.
Split ARPDAU into three parts
ARPDAU = daily payer rate × daily ARPPU + ad revenue per daily active user
Daily payer rate is the share of active players who pay that day. Daily ARPPU (average revenue per paying user) is what each of those payers spends that day.
Take an illustrative day with 20,000 active players. 400 of them pay, for $6,000 in purchases, and ads bring in $2,000.
| Part | Calculation | Value |
|---|---|---|
| Daily payer rate | 400 ÷ 20,000 | 2% |
| Daily ARPPU | $6,000 ÷ 400 | $15 |
| Purchase revenue per active player | 2% × $15 | $0.30 |
| Ad revenue per active player | $2,000 ÷ 20,000 | $0.10 |
| ARPDAU | $0.30 + $0.10 | $0.40 |
If you need the formulas and the choices behind them, such as gross or net revenue and which players count as active, our guide to ARPU, ARPPU and ARPDAU covers them.
Find the lever that moves ARPDAU most
A 10% gain on a large part of the total adds more than a 10% gain on a small part. In the example, purchases make up $0.30 of the $0.40 and ads make up $0.10.
| Change | New value | New ARPDAU | Change in ARPDAU |
|---|---|---|---|
| Payer rate up 10% | 2.2% | $0.43 | +$0.03 |
| ARPPU up 10% | $16.50 | $0.43 | +$0.03 |
| Ad revenue per player up 10% | $0.11 | $0.41 | +$0.01 |
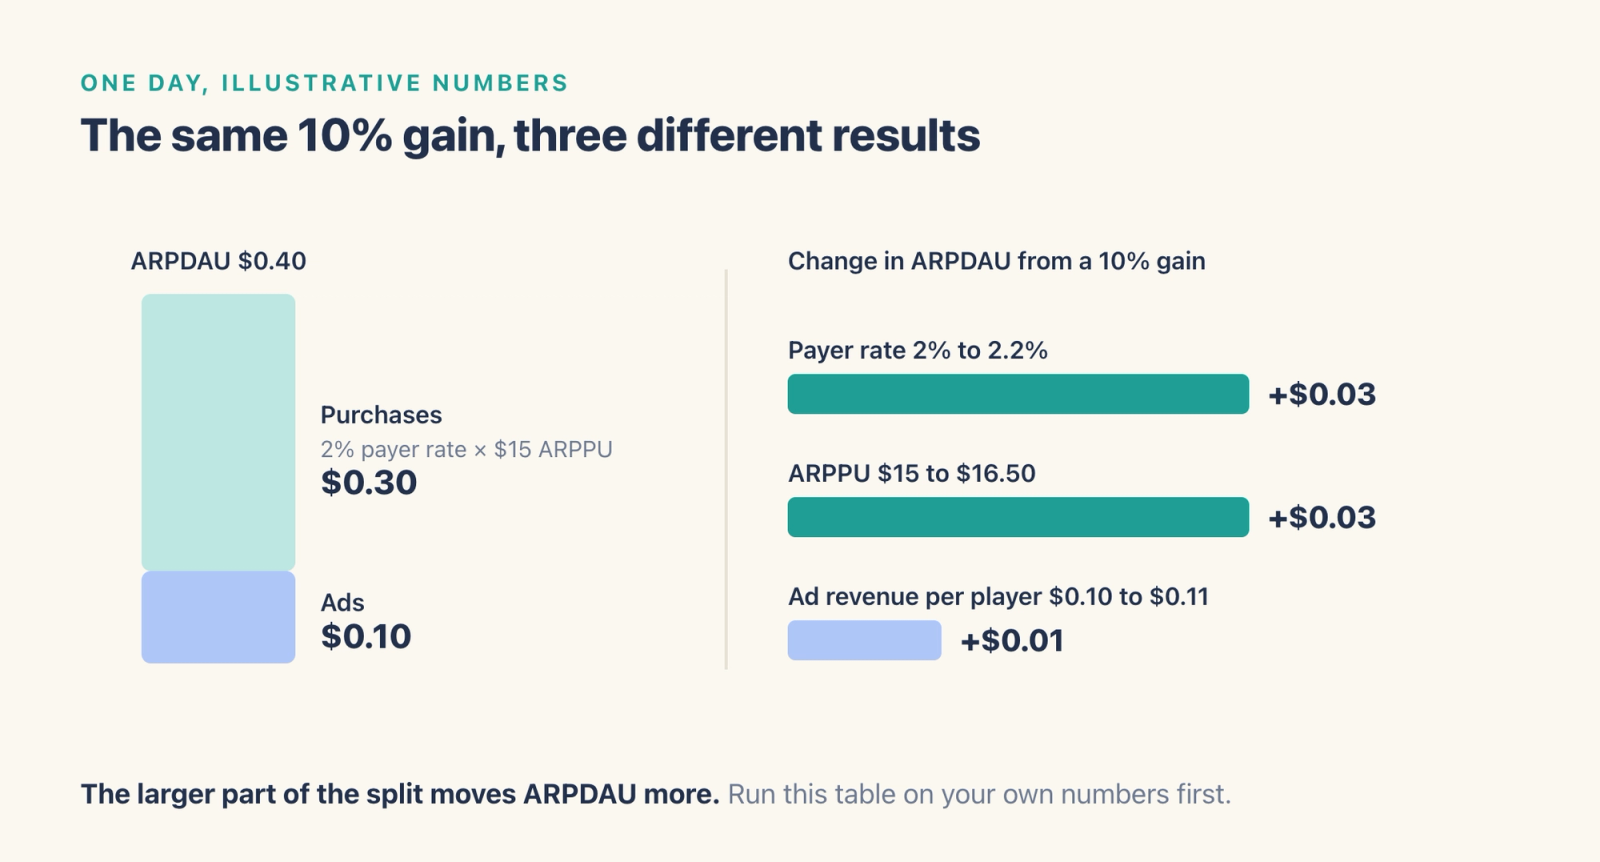
For this game, a 10% gain on either purchase lever is worth three times a 10% gain on ads. A game that earns most of its revenue from ads gets the opposite result. Run the same table on your own numbers before you choose where to spend the next month of work.
Speed matters too. Offer and price changes act on players who already pay, so they usually show up in ARPDAU within a day or two. An ad placement change shows up in ad revenue within a day or two, and its cost to retention shows up over the following week. A starter offer can lift the daily payer rate within days. Lasting gains in payer rate build more slowly, because they depend on new players reaching a first purchase.
Raise purchase revenue by player group
Players who have never paid, players who pay small amounts and players who pay a lot respond to different offers. Split payers into spend ranges first, for example under $5, $5 to $50 and over $50 in the last 30 days, and pick a lever for each group.
- Players who have never paid. A low-priced first offer can raise the payer rate. Measure the share of players who make a first purchase within seven days of seeing it.
- Small payers. Offers that bundle what these players already buy, at a better rate, can raise ARPPU. Measure the move from the lowest spend range to the next one.
- Large payers. Higher price tiers give players who want to spend more a way to do it. Measure ARPPU and the share of payers in the top range, and watch for a drop in purchase frequency.
Test prices one change at a time. Two price points for the same bundle, shown to two random groups in the same week, tell you more than a price change compared with last month.
Raise ad revenue without a heavier ad load
More interstitial ads, the full-screen ads that appear between levels or screens, raise ad revenue per player, and they also cost retention, which lowers the active players that every future day's ARPDAU is built on. Three levers raise ad revenue with less of that cost.
Start with rewarded placements, where players choose to watch in exchange for something in the game. Raise the share of active players who watch at least one rewarded ad by placing the offer at moments where the reward helps, such as after a failed level.
Next, set frequency by player group. Players who pay already bring in purchase revenue, so they can see fewer interstitials. Keep the total number of interstitials the same and shift them toward groups whose retention holds up.
Last, review your mediation setup, the system that picks which ad network fills each ad slot. Letting networks bid against each other and setting a minimum price per ad change what each ad shown earns, with no extra ads.
Measure ad revenue per player and day 7 retention together for each change. Our guide to mobile ad monetization shows how to set a different ad strategy for each player group.
Use event days
Events and limited-time offers give returning players a reason to spend, and they show up in ARPDAU right away. Plot ARPDAU every day and mark event dates. Then check the days after each event, because purchases pulled forward from next week show up as a dip once the event ends. Our guide to planning a LiveOps calendar covers how to measure an event's return net of that dip.
Size a new revenue stream before you build it
A new revenue stream, such as a monthly pass, usually adds less ARPDAU than a first estimate suggests, because some of its buyers move spend from offers they already buy. Estimate it in three steps.
- Gross revenue per day. Suppose 3% of the 20,000 active players buy a $10 monthly pass. 600 buyers × $10 ÷ 30 days = $200 a day, or $0.01 per active player.
- Spend that moves. Suppose those 600 buyers would otherwise spend $5 a month on other offers. 600 × $5 ÷ 30 days = $100 a day comes off the gross.
- Net uplift. $200 − $100 = $100 a day, or $0.005 per active player. On an ARPDAU of $0.40, that is a lift of 1.25%.
The share of spend that moves is the assumption that matters most. Pass buyers are often players who already pay, so test a higher figure too. A small net uplift can still be worth it if the pass also raises retention, because longer-lived players add revenue for more days. Measure retention for pass buyers against similar players who skipped the pass, and count that in the decision.
Measure the lift with a control group
ARPDAU changes for many reasons at once, including weekends, holidays and new content. A control group separates the effect of your change from the rest.
- Change one lever per test. If you change a price and an ad placement in the same week, the result will show only the combined effect.
- Keep a random control group. Hold back a random share of eligible players from the change, for example 10%, and keep them on the current offer or setup.
- Run full weeks. Spending differs by day of the week, so run at least one full week, and two if purchases are infrequent.
- Read revenue and retention together. Compare revenue per player and day 7 retention between the groups. When one rises and the other falls, the test shows the size of the trade-off, and your team makes the call.
- Watch for large payers. A few big purchases can swing a small group, so put enough players in each group for revenue to settle, and check the result again with the largest payers left out.
How to run it in Agentic Engine
In Agentic Engine, the work runs from the alert that spots a change to the report that measures the fix.
Spot the change. Metric alerts watch ARPDAU or its parts and send a notification when a value moves past a rule you set, such as a drop against the same period yesterday. An Automation can run an Agent on a schedule for a daily revenue check.
Find the cause. Split the change into payer rate, ARPPU and ad revenue per player, then by player group. Distribution Analysis divides payers into spend ranges, so you can see which range moved. Community data from social media, game communities and live streams, with sentiment and hot topics, shows whether players are talking about a price or an offer.
Act on it. In Engage, an operation task delivers the offer to the player group you chose, and a campaign groups the tasks that share one goal. A campaign can be submitted for approval before it goes live.
Measure it. Turn on an A/B test in the operation task to compare offers, such as two gift pack prices, and set the control group to receive no push. The A/B test report compares the control group with each experiment group. For changes inside the game, such as an ad placement, the experiment suite assigns different in-game settings, such as ad frequency, to each experiment group. It is available as an add-on.
Frequently asked questions
What is a good ARPDAU?
It depends on the genre, the revenue mix and the markets a game sells in, so a figure from another game is a weak target. Track your own ARPDAU over time, compare event days with normal days, and compare the parts of the split from month to month.
What is the fastest way to increase ARPDAU?
Offers and prices for players who already pay, and starter offers for new payers, usually show up within a day or two, because they act on players who are active today. Check which part of the split is largest for your game first, since the same relative gain on a larger part adds more.
Does increasing ARPDAU hurt retention?
It can. A heavier ad load or aggressive offers can raise today's revenue and lower the number of players who return. Measure day 7 retention alongside revenue per player for every change.
What is the difference between ARPU and ARPDAU?
ARPU divides revenue by the players active over a period, such as a month. ARPDAU divides one day's revenue by that day's active players, which makes it the better metric for tracking a change or an event day by day.
Where to go next
To calculate the metrics in this guide, start with ARPU, ARPPU and ARPDAU. For ad revenue by player group, see mobile ad monetization. To measure events, see our guide to planning a LiveOps calendar, and to turn daily revenue into value per player, the LTV formula for games and apps.