
An A/B test result has two parts. One is the measured difference between the groups, and the other is the confidence interval, the range of true differences that fit the data. For example, a lift of 6% with a 95% confidence interval of +2.1% to +9.9% means something different from the same 6% with an interval of −4% to +16%.
Both parts depend on the test running the way it was planned. This guide explains how to read the confidence interval, then works through the checks that decide whether to trust it. They cover the split, the sample size, a lift that fades, guardrails and conflicting results, the daily data and the test design. The numbers in the examples are illustrative.
Read the confidence interval first
The lift is how far version B moved the key metric compared with version A, the control group. The confidence interval is the range of lifts that fit the data, and these examples use the 95% level, the most common choice. Where the interval sits against zero tells you which of three results you have.
| Result | Lift of B over A | 95% confidence interval | What it means |
|---|---|---|---|
| Clear increase | +6.0% | +2.1% to +9.9% | The whole range sits above zero, so B raised the metric |
| No clear change | +0.8% | −3.1% to +4.7% | The range crosses zero, so the test shows no clear difference |
| Clear decrease | −5.6% | −9.4% to −1.8% | The whole range sits below zero, so B lowered the metric |
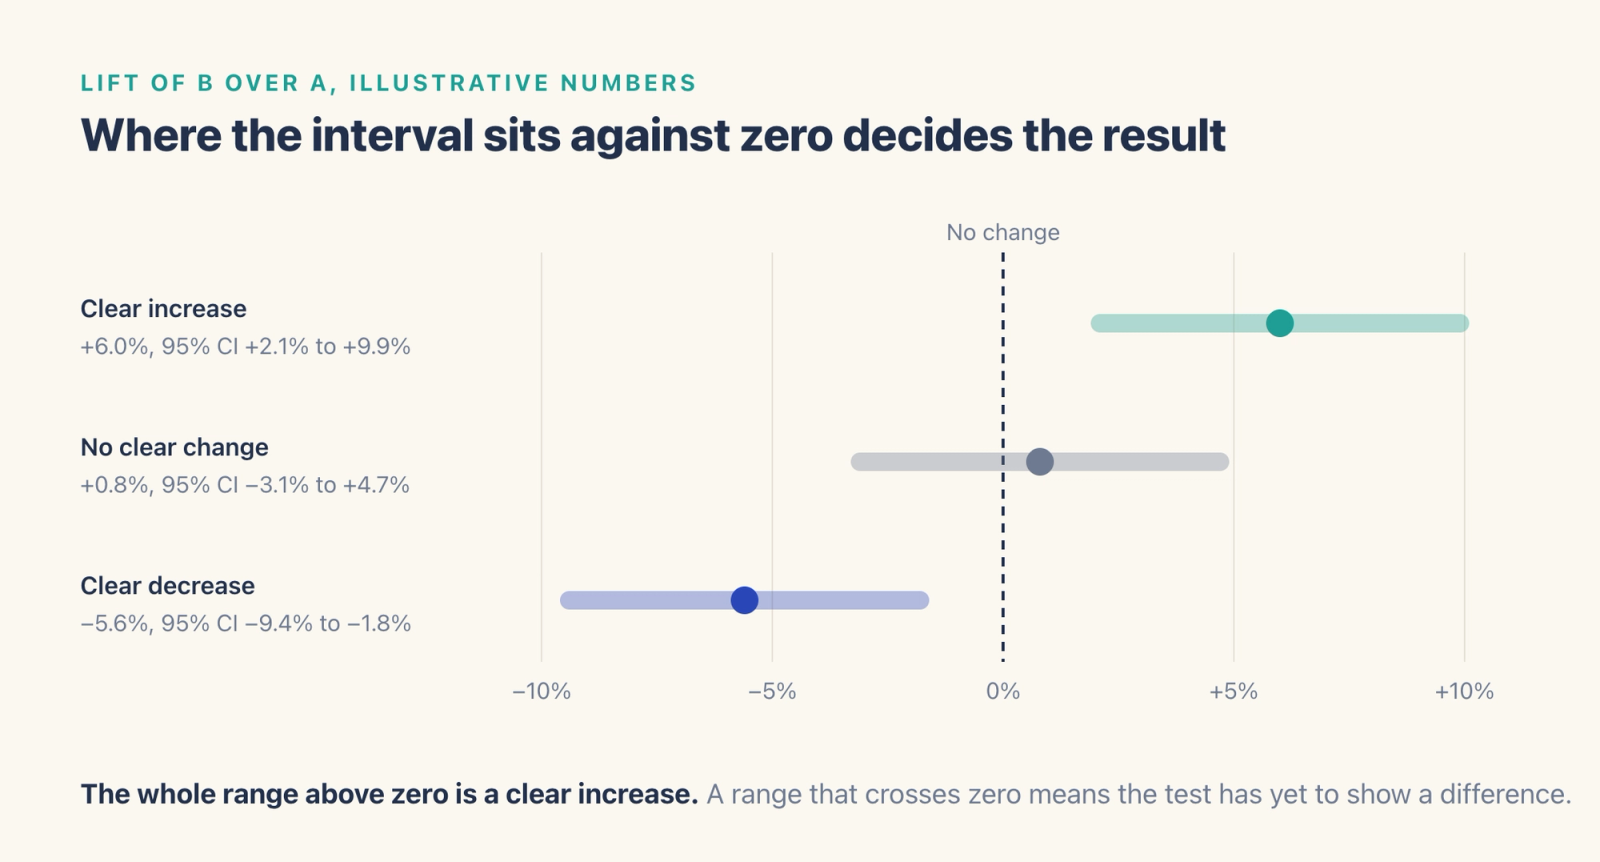
The P value measures how surprising the gap would be if B had no effect at all. When the interval and the P value come from the same test, as in these examples, a 95% interval that sits entirely above or below zero goes with a P value below 0.05. In the example, a P value of 0.003 on the +6.0% lift means a gap this large or larger would be rare if B changed nothing.
Two readings often go wrong. The first treats no clear change as proof that B has no effect. In the example, the interval of −3.1% to +4.7% still allows a 3.1% loss or a 4.7% gain, so the result reflects how precise this test was, and a larger test might settle the question. The second treats any clear result as worth shipping, even one too small to matter. For example, an interval of +0.3% to +1.1% from a large test is a real increase, and it may still fall short of the lift that pays for shipping B. Agree on that smallest useful lift before the test starts, then compare the interval with it.
Check the direction of the metric as well. For refunds or crash rate, lower is better, so a clear decrease on those metrics is the result you hoped for.
Check the split before the effect
Sample ratio mismatch (SRM) means the groups ended up a different size from the plan. If you planned a 50/50 split and the data shows 54/46, something in assignment or logging treated the groups differently, and the effect you measured may come from that difference and have little to do with version B.
Test the split with a chi-square goodness-of-fit test on the number of users assigned to each group. This example treats a P value below 0.01 as a failure, a common threshold, and some teams use 0.001 on large tests to cut false alarms. In the example below, 20,000 users entered a test planned at 50/50.
| Users in A | Users in B | Split | Chi-square | P value | Verdict |
|---|---|---|---|---|---|
| 10,100 | 9,900 | 50.5/49.5 | 2.0 | 0.16 | Passes |
| 10,200 | 9,800 | 51/49 | 8.0 | 0.005 | Fails |
| 10,800 | 9,200 | 54/46 | 128 | below 0.0001 | Fails |
A 51/49 split looks harmless and still fails at 0.01 in this example, though it would pass at 0.001. The more users a test has, the smaller the gap it takes to rule out chance.
The check tells you the split is off, and the cause is yours to find. Common causes include targeting rules evaluated differently for each group, a bug in assignment, users who switch from a device ID to an account ID partway through, bots or internal test accounts removed after assignment, and a rollout ramped up at different times for each group. Fix the cause and rerun before you read any effect.
Run this check on assignment counts. Counts of users who saw the change, or who reached the metric event, can differ between groups by design, so they make a poor substitute.
Wait for the planned sample
The number of users a test needs follows from three inputs, the baseline rate, the smallest lift worth detecting and how much certainty you want. For example, suppose 40% of new users finish onboarding today, and you want to detect a 2% relative lift, from 40.0% to 40.8%. With standard test settings of a 5% significance level and 80% power, meaning an 80% chance of detecting the lift if it is real, the test needs about 59,000 users per group. Divide that by the eligible users who arrive each day to get the duration, then round up to full weeks, since users behave differently on weekdays and weekends.
Reading the result before that point is where many tests fail. Looking at the dashboard every day and stopping at the first significant day raises the chance of a false result well above 5%, which we found by simulating 10,000 A/A tests. In each one, both groups got the same experience, 2,000 users per group arrived each day at a 40% baseline, and we checked the result on each of 14 days. About 21% showed a significant difference on at least one day. At the planned end on day 14, 4.9% did in our simulation, close to the expected 5%. If your team needs to look early, use a sequential testing method built for repeated looks, which holds the false positive rate at the level you set.
Below 80% of the planned sample, treat the test as incomplete whatever its current P value says, and make the final call at the planned end. A full sample still leaves room for the lift to move over time, and the next check looks for that.
Look for a lift that fades
A novelty effect is a lift that comes from the change being new. Players tap a redesigned shop button because it looks different, and the gap closes once the button becomes familiar. The opposite also happens. Regular users can push back on a change for the first few days and settle later, which is often called the primacy effect or change aversion.
To check, let the test run at least two full weeks, so each half covers one week, then compare the lift in the first half with the lift in the second half. Suppose a 14-day test shows +9.0% over days 1 to 7 and +3.0% over days 8 to 14. An early lift more than 1.5 times the late lift, with the late lift still falling, is a warning sign.
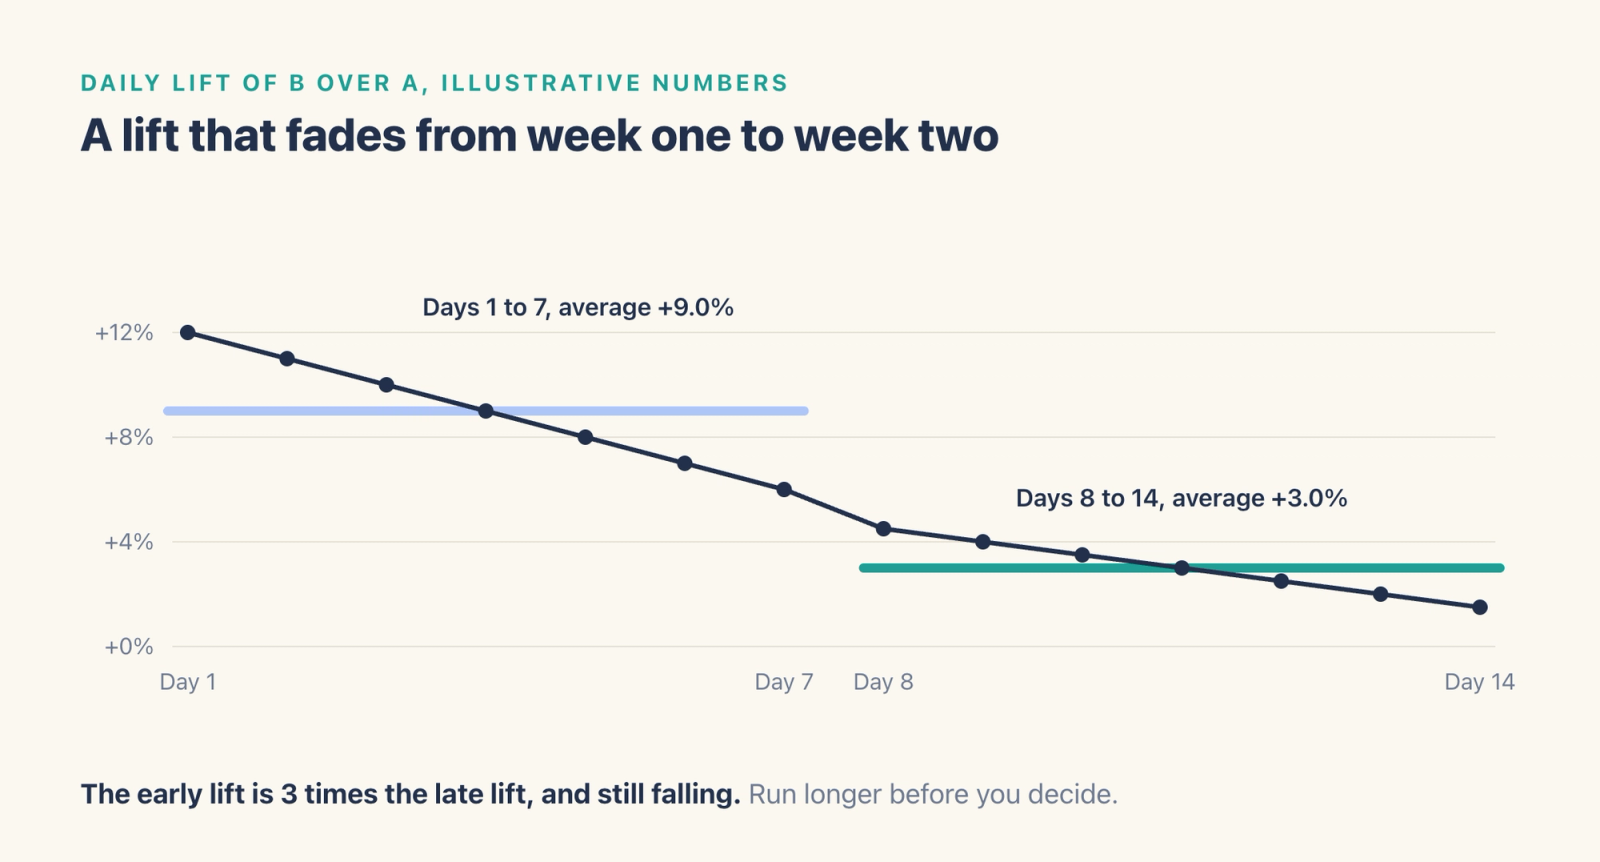
The pattern calls for a second look before any conclusion, since a falling lift can also come from a change in who enters the test, such as a marketing push that brings in a different audience halfway through. When you see it, run the test longer, or compare users by how many days have passed since they first saw the change, before you decide.
Read guardrail metrics and conflicting results
A guardrail metric is one the change must leave intact, such as refunds, crash rate or day 7 retention. For example, a shorter checkout that raises purchases by 4% and also raises refunds by 15% has a trade-off your team has to price before it ships. Before the test starts, name the guardrails and the most harm you would accept on each.
With more than one test group, compare each group with the control group and adjust for the number of comparisons. A Bonferroni correction divides the 5% threshold by the number of comparisons, so with three test groups each one needs a P value below about 0.017, and the matching interval widens to about 98.3%. When one test group is clearly up and another is clearly down on the key metric, compare what each version changed and check how both were built before you pick one, since the cause most likely sits in what differs between them.
Check the data behind each day
Look at the daily counts of assigned users, users who saw the change and users who reached the metric event, for each group, along with the ratio of A to B in each count. Gaps, sudden zeros and a ratio that shifts on one day usually point to a logging or release problem, such as an app version that stopped sending an event in one group.
With enough days of data, mark any day more than three standard deviations from the daily average. Skip this rule on a short test or during a ramp, since a trend or a weekly cycle in the counts breaks the average. A single odd day can be a holiday like Thanksgiving. More than two odd days call for a look at the data pipeline before you trust the totals.
Put the checks together
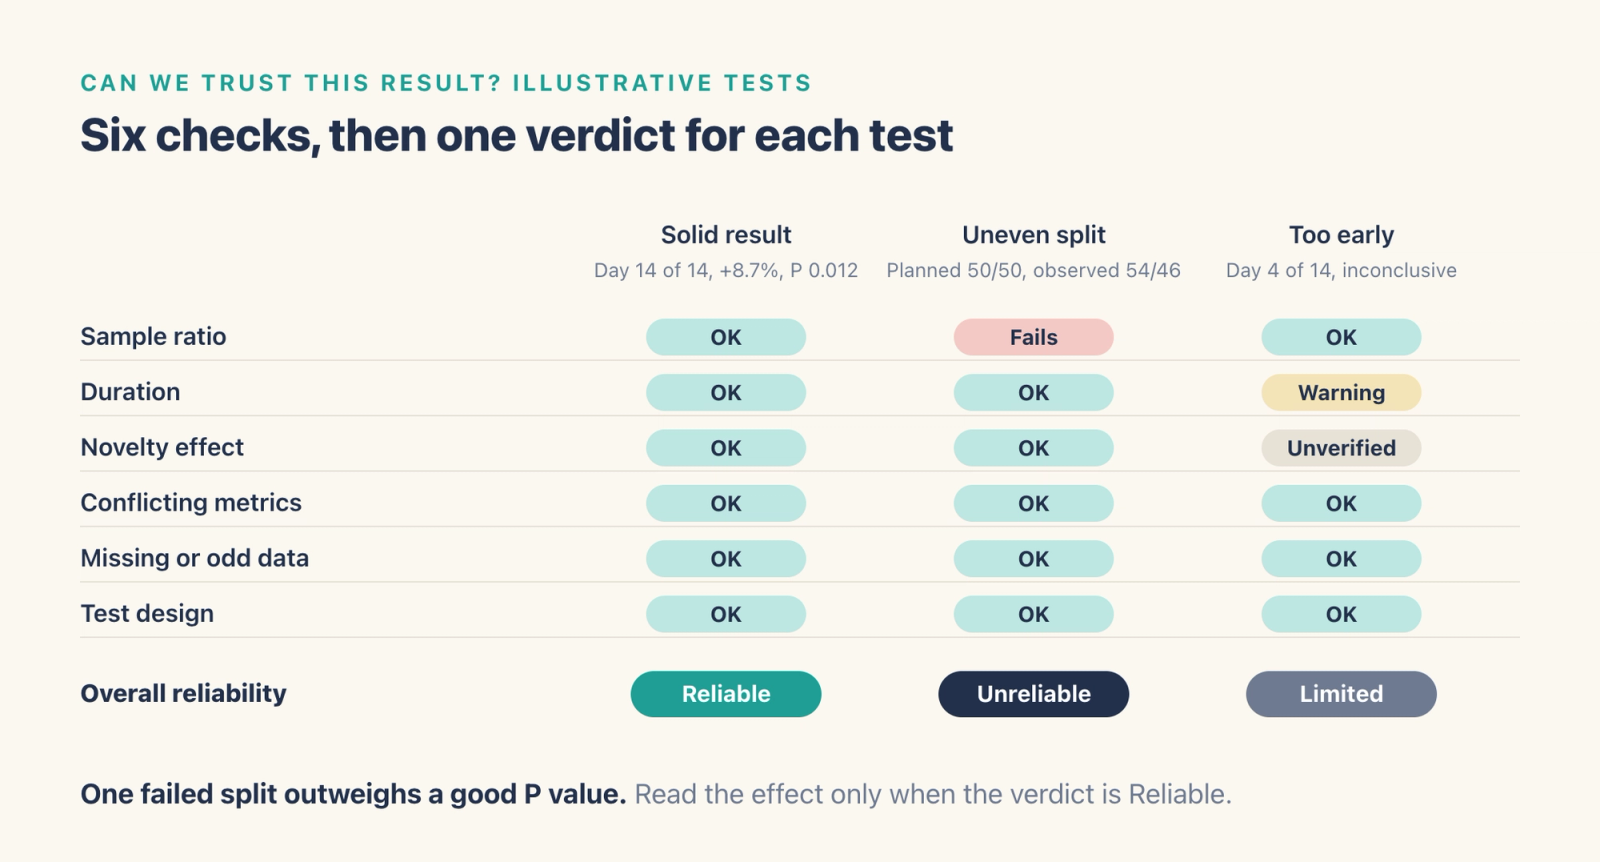
The test design check comes last. It confirms that the key metric, its direction and the planned split match the question the team set out to answer, and that the unit you randomize on matches the metric, such as users for a per-user metric. Run the checks in order and give the test one overall verdict.
| Verdict | When it applies | What to do |
|---|---|---|
| Reliable | The split passes, the planned sample is reached, and no open warning could change the decision | Read the effect and decide |
| Limited | Nothing is broken, and a warning on duration, novelty, conflicting results, odd data or design is still open | Keep the test running, or resolve the warning first |
| Unreliable | The split fails, assignment or logging is broken, or the key metric is defined wrong | Fix the cause and rerun |
How to run it in Agentic Engine
In Agentic Engine, the experiment suite, available as an add-on, keeps the plan, the split and the report in one place.
Plan the test. The docs recommend setting up in the order Feature, Metrics, Traffic layers, then Experiments. A Feature holds the value the test changes, and each group gets a different value. Each experiment records a hypothesis, a stop condition, for example a 30-day runtime, and its statistical metrics. These can be key, secondary and guardrail metrics. Each metric has a direction, so lower values count as better for a metric such as refunds. A traffic layer makes sure a user matches at most one experiment rule within the same layer, which keeps overlapping tests apart.
Read the report. Experiment Statistics shows each group's performance against the control group, with P values and confidence intervals, along with the experiment timeline, group entry data and metric trends. The docs advise waiting until there are enough experiment samples before judging the result. Pausing an experiment requires a reason, and the log records who launched, paused and ended it.
Check whether to trust it. The A/B Test Agent checks that users were split as planned, looks at duration and data quality, then explains the result. It tells you when a test has too little evidence to reach a conclusion, and it asks for your approval before it submits, starts, changes live traffic, pauses, ends or deletes an experiment. ae-cli, the command line tool, can run from a coding agent to compare metric results across experiment groups and summarize significance, trends and risks that need attention.
Frequently asked questions
What does a confidence interval mean in an A/B test?
It is the range of lifts that fit the data at a chosen level, for example 95%. When the whole range sits above zero, the test shows an increase. When it crosses zero, the test shows no clear difference yet.
What is sample ratio mismatch?
It means the groups ended up a different size from the planned split, for example 54/46 on a test planned at 50/50. Check it with a chi-square test on assignment counts, and fix the cause before you read the effect.
How long should an A/B test run?
Long enough to reach the sample size you planned from the baseline rate and the smallest useful lift, rounded up to full weeks. Stopping at the first significant day raises the false positive rate, which went from 5% to about 21% in our simulation.
What is the novelty effect in A/B testing?
It is a lift that comes from a change being new and fades as users get used to it. Compare the lift in the first and second halves of the test to spot it.
Where to go next
To measure an offer against a control group that receives no push, see our guides to increasing ARPDAU and planning a LiveOps calendar. To test ad creatives through to revenue, see creative testing, and to follow test groups over the weeks after a test, see cohort analysis for games and apps.