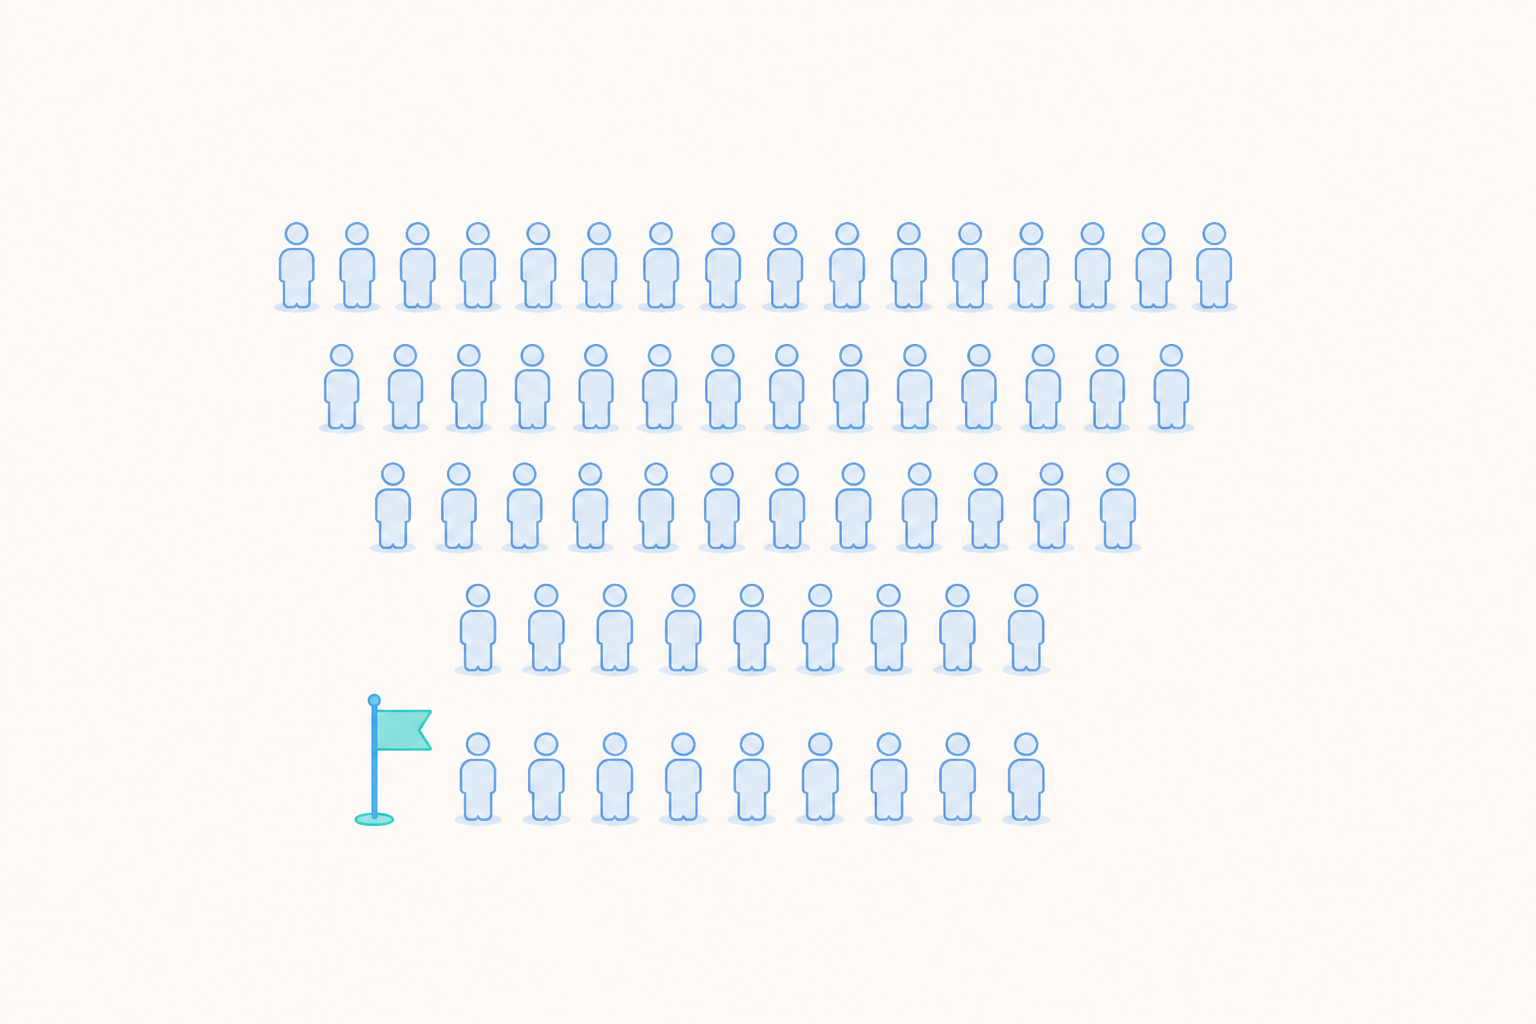
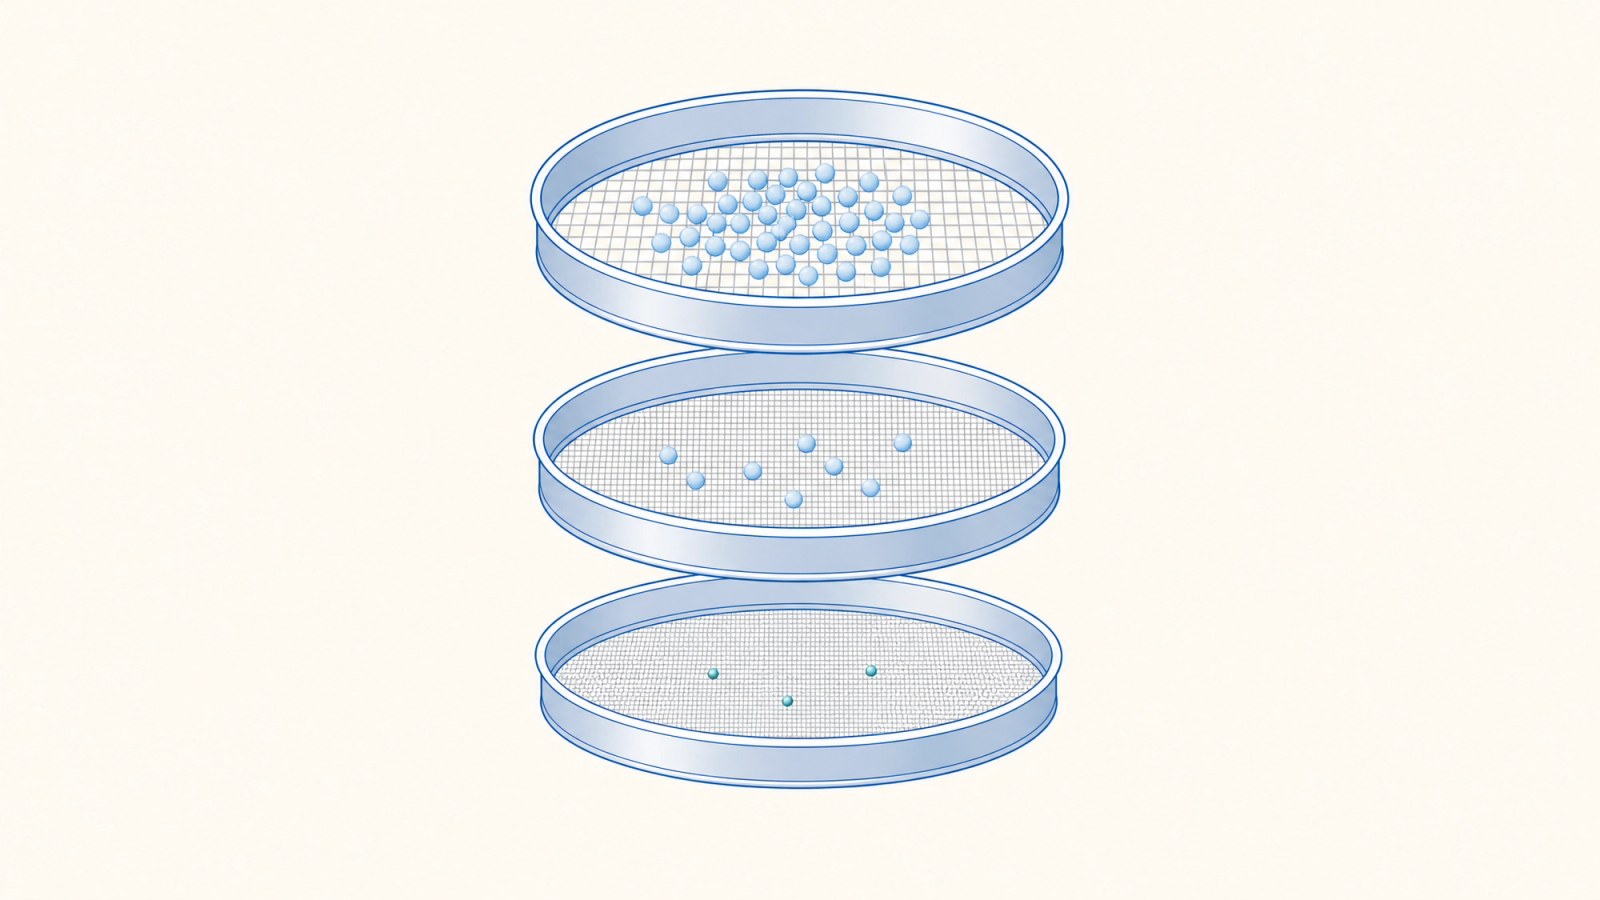
Funnel analysis follows users through an ordered set of steps, such as opening the app, finishing the tutorial and making a first purchase, and shows how many reach each one. For example, if 40,000 new players open a game in one week and 3,514 of them pay, the funnel shows how far each of the other 36,486 got through the steps in order.
A funnel shows where users stop moving through the steps, and the next question is who those users are and what they did around that point. This guide covers reading a funnel, setting its window, choosing a drop, comparing segments and studying the users behind a step. If your events are still missing, start with event tracking without SQL, which ends with your first funnel. The numbers in the examples are illustrative.
What a funnel measures
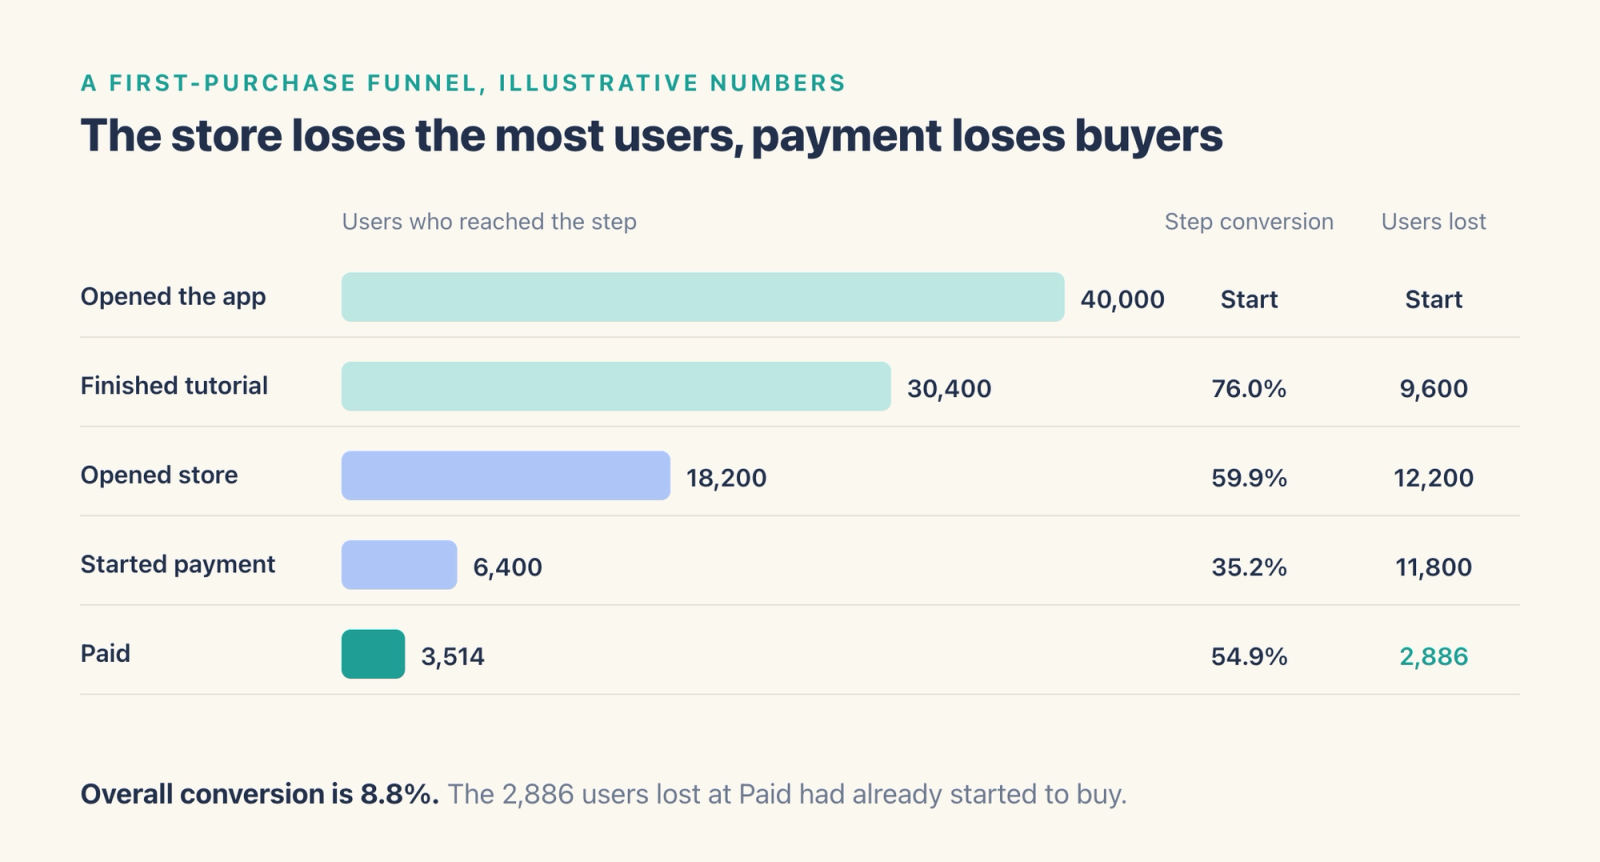
A funnel is a list of events in a fixed order that counts the users who complete each step after the steps before it. In the example below, a game tracks five steps for one week of installs, from Opened the app to Paid, the first purchase.
| Step | Users | Step conversion | Users lost before this step | Overall conversion |
|---|---|---|---|---|
| Opened the app | 40,000 | Start | Start | 100% |
| Finished tutorial | 30,400 | 76.0% | 9,600 | 76.0% |
| Opened store | 18,200 | 59.9% | 12,200 | 45.5% |
| Started payment | 6,400 | 35.2% | 11,800 | 16.0% |
| Paid | 3,514 | 54.9% | 2,886 | 8.8% |
Step conversion divides each step by the step before it, and overall conversion divides it by the first step. Overall conversion, 8.8% in the example, shows how the whole flow performs, and step conversion shows which transition loses users.
Order. A user counts at a step only after completing every earlier step in order. Other events in between usually leave the count unchanged. A player who reaches payment from a push link, skipping the store, drops out at Opened store, so build the steps around the path users actually take.
Unique users. Each step counts a user once, so repeat store visits leave the count unchanged. Settle early on which ID counts as a user, since a device ID splits one player across a phone and a tablet while an account ID merges them.
Set the conversion window and the date range
The conversion window is how long a user has, counted from step 1, to complete the later steps. For example, with a one-day window a player who installs on Friday and pays on Sunday counts as lost at Paid. With a seven-day window the same player counts as converted.
Base the window on how long users usually take to convert. Look at the time from the first to the last step for users who did convert, and cover most of them, for example the time within which 90% of first purchases happen. Onboarding takes minutes, while a first purchase in a free-to-play game can take days.
Recent days need care. A user who entered yesterday has had one day of a seven-day window, so the latest days look worse than they will later. End the date range one full window before today, or mark the recent days as provisional. When you compare two funnels, keep the window, the steps and the user ID the same, because each of them moves the numbers.
Find the drop worth fixing
The transition with the lowest conversion looks like the place to start, though a rate that has held steady for months is a weaker lead than a recent change. In the example, Opened store to Started payment converts at 35.2% and loses 11,800 users. Both transitions around the store lose many users because browsing without buying is common, and those losses may hold steady from week to week.
Three questions narrow the list. Has the step changed against its own history, such as the weeks before a release? Does it differ between segments that should behave alike? How much intent did the lost users show? Starting payment signals far more intent than browsing, so the 2,886 users lost at Paid in the example are a sharper group to study than the users who glanced at the store.
A drop-off rate that rose after a release, or that appears in one segment only, gives you the clearest lead. A drop that has always been there can be normal behavior or old friction, so check errors and intent before you decide which it is.
Break the funnel down by segment
A breakdown splits each step by a property, such as acquisition channel, platform, country, app version or spend tier. In the example, payment conversion is 54.9% overall, and the breakdown by channel shows wide gaps.
| Channel | Started payment | Paid | Payment conversion |
|---|---|---|---|
| Organic | 2,600 | 1,742 | 67.0% |
| Paid social | 1,400 | 812 | 58.0% |
| Video ads | 2,400 | 960 | 40.0% |
| All channels | 6,400 | 3,514 | 54.9% |
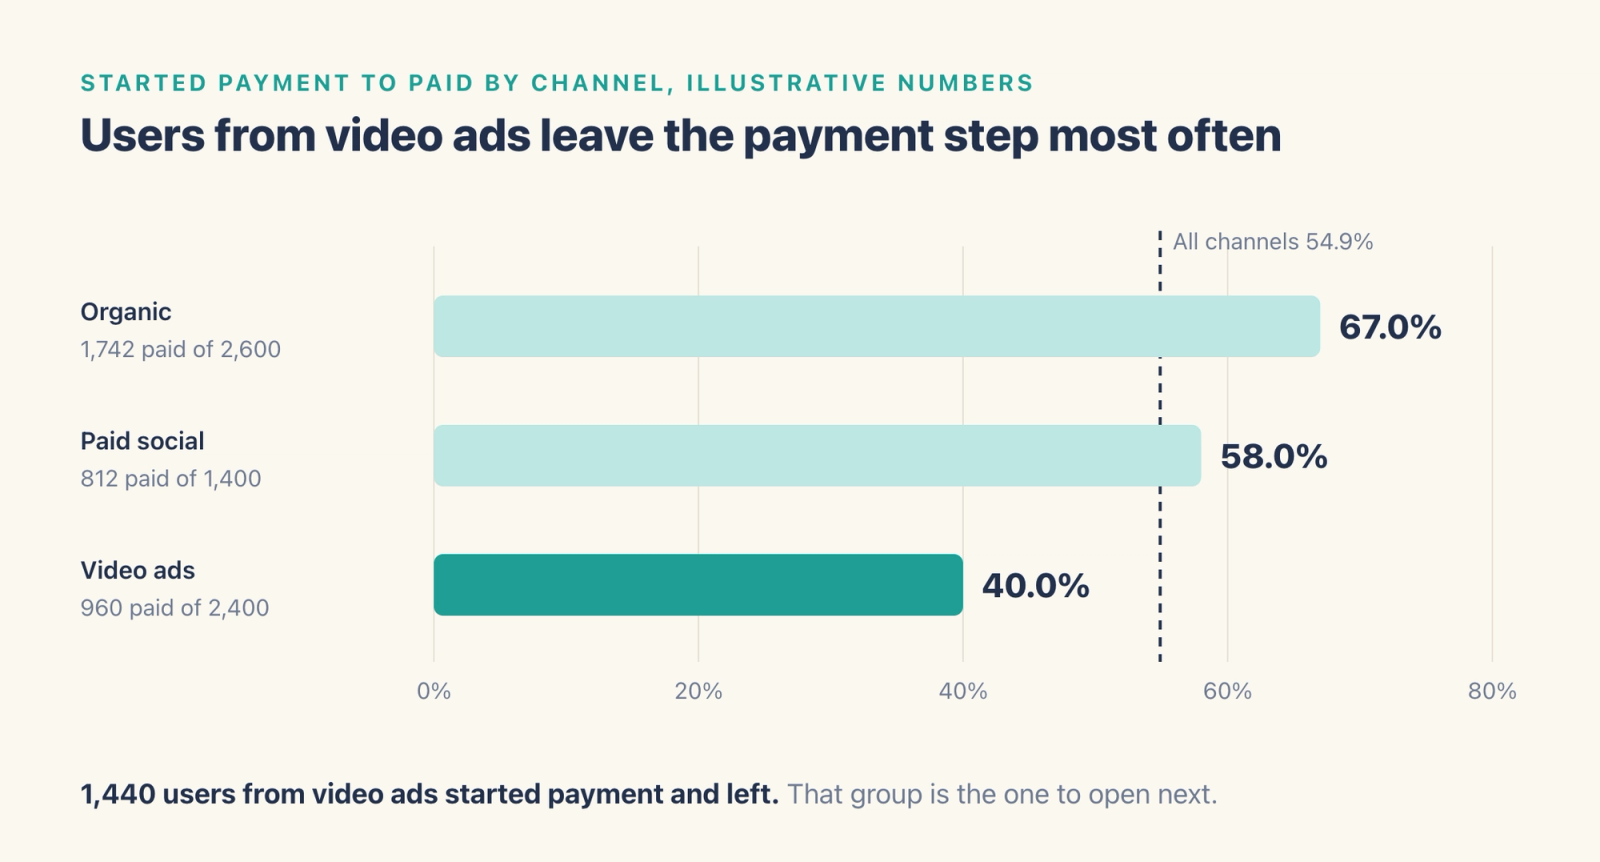
In the example, 1,440 users from Video ads started payment and left. If they had paid at the Organic rate, about 650 more users would have paid that week. Treat that as a rough benchmark, since organic users often arrive with more intent.
Breakdowns also explain why a step's overall conversion changes while each segment holds steady. For example, if Video ads grow from 30% to 50% of payment starters, Organic falls from 50% to 36% and Paid social from 20% to 14%, overall payment conversion drops from 57.1% to 52.2% while every channel converts at its usual rate. The whole decline comes from the change in channel mix, so check each segment's share before you conclude a step is broken.
From a drop-off count to the users behind it
The funnel shows that 1,440 users from Video ads left after Started payment, and four steps take you from that count to the users behind it.
Open the users behind the count. Pull the list of users who reached Started payment without paying, and tally values such as country, device, app version and the offer they picked before you read any sequences. For example, if 70% of the list uses one app version that accounts for only 40% of Video ads payment starters, that version is worth a closer look.
Read what individual users did. A behavior sequence lists one user's events in time order. Read 10 to 20 sequences picked at random, and note what happens right before and after the step where each user stopped. In the example, one sequence reads Opened store at 10:04, Started payment at 10:06, Payment failed at 10:06 and Closed the app at 10:07.
Measure how common the pattern is. One sequence suggests a possible explanation, and the same pattern measured across the whole group shows how common it is. For example, if Payment failed appears for 41% of the Video ads users who left and 9% of the Organic users who left, break those failures down by payment method and country.
Save them as a cohort and act. A saved list of IDs is a snapshot of who left that week, and it keeps the same users in the next analysis and campaign. A rule, such as installed from Video ads and started payment with no purchase in the seven days after the first step, recalculates on each update, so users enter and leave it. Include only users whose seven days have passed, and check the cohort's count against the funnel before you use it. Then test a response to the likely cause, such as fixing a payment method or sending a reminder after a failed payment, and judge the result with the checks in how to read A/B test results.

Common funnel analysis mistakes
Reporting the latest days early. Users who entered inside the last window are still converting, so a dip in the most recent days is often an artifact of timing. Wait for the window to close before calling it a decline.
Treating every drop-off as churn. A user who leaves the funnel skipped the next step inside the window, and many of those users are still playing the next day. Check whether they are still active before you call them lost, since churn is a separate measure, covered in how to calculate churn rate.
Treating a sequence as proof. A handful of sequences suggests a cause, a count across the group shows how common the pattern is, and a controlled test shows whether a fix changes the outcome. Watch a guardrail metric too, since a change that lifts payment conversion and lowers day 7 retention is a trade-off to weigh before it ships.
How to run it in Agentic Engine
In Agentic Engine, Funnel Analysis observes conversion and churn at each step of a process, and the user list, behavior sequence and cohorts take you from a step to the users behind it.
Build the funnel. You set the events users trigger in sequence as the steps. A user completes the funnel by finishing the steps in order, whatever happens in between, and Custom Events combine two or more events into one step when any of them counts. The Conversion Window runs from 1 minute to 180 days, counted from the time a user triggers step 1. Hold Property Constant requires a property, such as a product ID, to match across steps, so impression, click and purchase refer to the same product.
Compare segments and trends. You can group by an event property, user property, cohort or user tag of a specific step. The Conversion Plot shows overall conversion across the time range, and the Line view shows the daily conversion rate for all steps, or between any two steps you choose.
Go from the count to the users. Counts of users in a result table open the matching user list, which shows details of up to 1,000 users and lets you download the full data or save them as a result cohort. The behavior sequence shows one user's properties, latest tags and events, Switch User steps through the group one user at a time, and View behavior shows what a user did before and after an event. A result cohort saves that set of user IDs, and a behavioral cohort saves a rule and can update on a schedule every day.
Ask the Analytics Agent. For drop-off questions, the Analytics Agent finds the step that loses the most users and traces what they do next. Each conclusion comes with a table of the numbers and a link to the full report, and a follow-up can change one factor at a time, such as install channel. The agent works within the asker's permissions and changes nothing your users see. In Agent Team (Beta), an Engage task waits for approval before it reaches users, so the agents do the legwork and a person decides what users receive.
Frequently asked questions
What is funnel analysis?
It counts the users who complete an ordered set of steps, such as install, tutorial and first purchase, and shows conversion and drop-off at each step.
What is a conversion window in a funnel?
It is the time a user has, counted from the first step, to complete the later steps, for example seven days for a first purchase.
How do you find the biggest drop-off in a funnel?
Rank the steps by step conversion and users lost, then compare each step with its own history and across segments. The best lead is usually a drop that changed recently or shows up in one segment.
Where to go next
To place funnels within the wider study of user behavior, read behavioral analytics explained. For event setup, use event tracking without SQL. To track a saved cohort after a fix, read cohort analysis for games and apps.